-2.png?width=156&height=60&name=Hawkin%20Logo%20(2)-2.png)

Introduction
So, you've been working with your athletes for some time now. You're nearing the end of a training phase and their programs seem to be yielding good results. Other than their ability to simply lift more weight, what evidence do you have for this? Here is where force plates provide their value. This article will walk you through 2 different force-time curves, and help you understand their differences in order to equip you with the necessary skills to draw insight & evidence.

Figure 1 shows 2 countermovement jump (CMJ) attempts from 2 different athletes. Both athletes in the figure are achieving a 60 cm (23.6 in) Jump Height. That's pretty awesome right? Potentially? Yes. Definitely? Goodness, no! Maybe...
This kind of situation is exactly what our system was built for. Not only does our system provide a quick and simple way of assessing Jump Height, but it can also provide the story that each CMJ tells.
Welcome to the first part of our force-time curve whisperer training course. It's designed to help you understand what the force (and other metrics)-time curves tell you about athletes, and how athletes reach a given jump height.
Let's Begin...
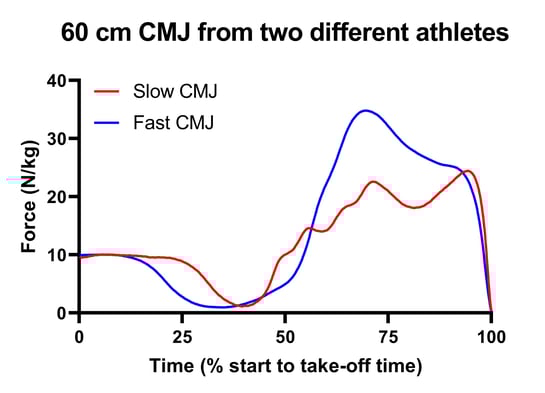
Figure 1. Force-time curves from two 60 cm CMJ. Data has been normalized with respect to the time from the jump start to take-off & with respect to each jumper's mass.
Establishing Context
Okay then. What do you see? And what does it tell you about these jumpers? Should we seek to change these at all? Could they be better and if so, how much might be realistic and how could you do that? Let's reign that back in a bit. I can tell you what the data are telling us but the training side of things is up to you guys.
Now, Figure 1 does provide a bit of a clue in as much as I've defined them as fast and slow CMJ. The time normalization can hide that to some extent. However, the pattern and magnitude of the force-time curves clearly show that not only does the fast jumper apply more force than the slow jumper (check the difference between the peak force heights around the 75% mark), but it's also applied faster (look at the slope from the lowest to highest force).
**Learn the flaws of RFD here: Part 1, Part 2, Part 3
Cool, right? Okay, but come on, you didn't expect me to leave you hanging there, did you...
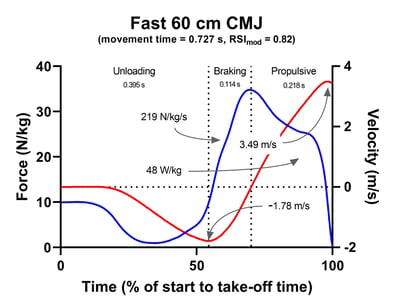
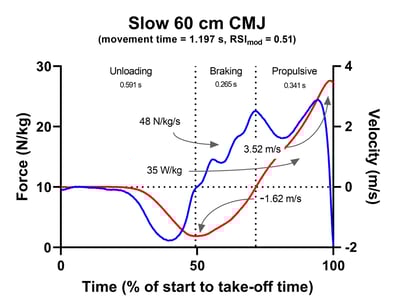
Figure 2. Force- and velocity-time data and some potentially useful data from the two 60 cm CMJ. Force is the blue line. Velocity is the red line.
Throughout this blog, the fast jumper is colored in blue, and the slow jumper is colored in red. Figure 1 should be used to compare.
More Context...
Let's dive deeper into Figure 2. Not only have we presented each jump separately, but we've also added the velocity-time curve. If you remember from previous blog posts, the velocity-time curve is really useful because it can help us identify different jump phases (i.e. unweighting phase, braking phase, propulsive phase, flight phase, landing phase).
**Note, that any velocity below the dotted horizontal line is negative and so represents negative (or downward) displacement (the countermovement). Therefore, any velocity above the dotted horizontal line is positive and so represents positive (or upward) displacement (the propulsive phase).
We can also look at the slope of the velocity-time curve. Would we expect these to differ from one another? Well, take-off velocity has to be pretty close because remember that jump height is dictated by take-off velocity (how quickly the jumper leaves the ground). How we get there can differ though. And, in fact, it does: perhaps unsurprisingly the braking phase of fast CMJ is performed faster (=1.78 vs. -1.62 m/s). The fast jumper's countermovement depth (i.e. how far the athlete dips down in the countermovement) is 35% less than the slow jumper's (38 vs. 51 cm) and their downward movement is slowed in a braking phase that's 57% shorter -- 0.114 sec vs. 0.265 sec (see Figure 2).
Of course, it's worth reminding ourselves that body mass shouldn't come into this analysis because force has been normalized relative to each jumper's body mass (literally: force/body mass). However, as noted above we can see that the fast jumper applies much more force than the slow jumper. The shape of the force-time curve is different too. Note that the fast jumper's peak force occurs at the lowest position the athlete achieves during the countermovement phase.
Conversely, the slow jumper's force-time curve is completely different. The slow jumper's force-time curve is a bimodal shape. Whereas the fast jumper's force-time curve is a unimodal curve. That's right, we have both unimodal and bimodal force-time curves that produced the same jump height. Do the curve shapes explain the fast-slow CMJ differences? Honestly? There isn't enough research out there at the moment for me to confidently say yes or no. In this case though, it's pretty clear that the fast jumper seems to literally bounce from their lowest squat position. It shouldn't surprise you to discover that the braking rate of force development (RFD, [force at lowest displacement - force at lowest velocity] / the time between these points) achieved by the fast jumper is much larger (219 vs. 48 N/kg/s).
Fast Jumper Relative Braking RFD = 219 N/kg/s
Slow Jumper Relative Braking RFD = 48 N/kg/s
Now, interestingly, the slow jumper performs more work during the propulsive phase (11.9 vs. 10.4 joules/kg). However, we know that the fast jumper performs their work faster and this means that they perform their work at a rate 26% faster than the slow jumper. This results in average relative propulsive power outputs of 48 vs. 35 W/kg. And you've no doubt noticed that peak power is quite conspicuous by its absence. There's no agenda here with this though. Instead, we need to remember that because jump height is based on take-off velocity, because both jumpers achieved 60 cm, and that peak power is the product of the force applied and the velocity achieved over one sample (0.001 s) that relative peak power had better be similar or we have some issues with our data.
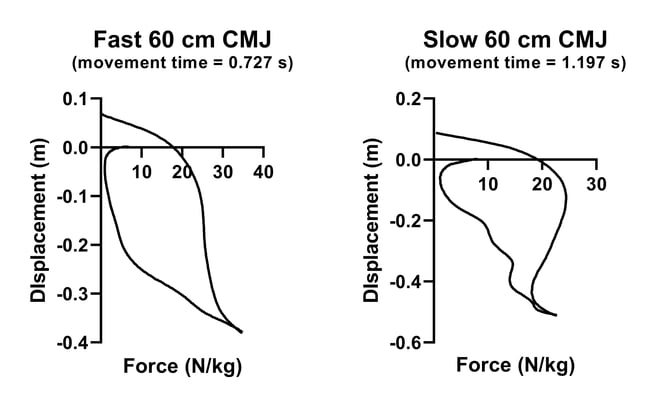 Figure 3. Force-displacement loops from the fast and slow 60 cm jumpers.
Okay, a few more things to consider...
Another way that can be useful to help you understand your jump data is to consider force velocity and force-displacement loops. Now, perhaps the clearest use of these can be found in the work of Prue Cormie. Check out Figures 3 and 4 -- Figure 3 shows some pretty distinct differences. Just by looking at the horizontal and vertical axes that the fast jumper dipped nowhere near as much as the slow jumper, and that the fast jumper applied more force. Now take a look at Figure 4, which shows velocity plotted against force. This reinforces what we already know that the fast jumper performed the countermovement faster and so had to apply more force compared to their slow jumper counterpart. What I really like about these 'loops' is that they highlight differences without even having to extract any actual data.
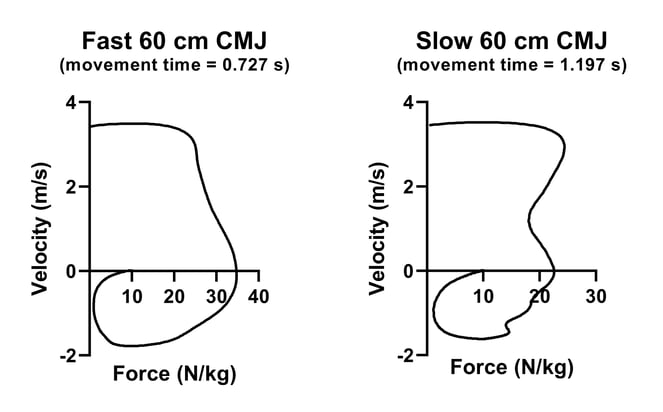
Figure 4. Force-velocity loops from the fast and slow 60 cm jumpers.
Conclusion
So, I've presented a couple of different ways that you can visualize your CMJ force-time data to get a clearer understanding of how a given jump height was achieved. Now you, dear user, might be asking: so what?
Simple. Use these methods to look past the numbers. There's nothing wrong with the numbers. However, I think that there's a lot to be gained by studying the pattern and magnitude of force-time, velocity-time, force-displacement, and force-velocity curves and that they're often overlooked. With that in mind, I'd like to recommend that you start this next phase of your force-time curve whisperer training by studying the pattern and magnitude of your athlete's force-time curves. Relate these to your data and you'll soon have a far clearer idea of where your athlete is at any given point in time.
Enjoy Dr. Lake's Blog Posts? Check out his video "Getting Started with Force Data" on YouTube.