-2.png?width=156&height=60&name=Hawkin%20Logo%20(2)-2.png)

Introduction
In the last article, I took you through some of the rate of force development (RFD) basics. We know that calculating RFD is pretty simple, on the surface at least. Although I only touched on it briefly, I'm hoping that I managed to give you a better idea of why RFD might not always be the best way to consider, well, RFD. At the risk of belaboring the point, I want to dig a little deeper into this. Of course, this may seem like me screaming for attention or a cry for help. I promise you it isn't though. Rather, it'll (hopefully) help to avoid making the same mistakes I've made far too many times over the years with this.
Before we go on, however, I want to make one thing absolutely clear: RFD is not inherently bad. How could it be? But, and this is a colossal but, there are other metrics out there that will enable you to quantify how force is applied over time. Combine this last point with the effect that how force-time data are collected so that you can calculate RFD can have on it and a compelling case could be made to avoid calculating it from the force-time curves of ground-based tasks (e.g. isometric mid-thigh pulls, squat jumps, countermovement jumps).
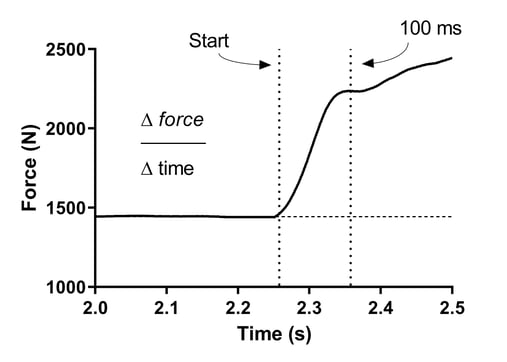 Figure 1. A typical isometric mid-thigh pull (IMTP) force-time curve showing the 'pull-start', an often-used time period of 100 ms after this, and the basic formula.
Factors affecting RFD
So, in the last blog, I described two ways of calculating RFD from isometric mid-thigh pull (IMTP) force-time data (Figure 1). In Figure 1 we see that if we want to calculate RFD using the first method I described we have to first identify the start. Once we have that, we can then identify time points over which it might be relevant to consider for the athlete(s) you're working with (e.g. the first 100 milliseconds [0.100 s]). If you're interested in this area and haven't done so already then I'd highly recommend reading this. If you have IMTP force-time data, then you could also have a go at processing it in a spreadsheet based on the guidelines outlined in this. Perhaps of greater use, might be to listen/watch Dr Paul Comfort talk about all things IMTP in one of the webinars Hawkin Dynamics ran a while ago.
Identifying the IMTP start
Now, unfortunately, something as seemingly simple as identifying the IMTP start has the potential to make fools of us all and wreak havoc on the quality of our RFD (and other) data. How should you identify the IMTP start? There are a few different ways, and none are necessarily better than the others. However, I think the following 'method', which uses signal/athlete (pre-pull movement) noise is the most robust/repeatable for most of us.
If, as per Figure 1, you've controlled your athlete to stand as still as possible and not pull on the bar (at all) until you've given the instruction to "pull" then you can average 1 second of the pre-pull force-time data. You can then calculate the standard deviation during the same period. Multiply the standard deviation by 5 and add this to the 1-second average force-time data and you have your threshold. The 'noisier' your force-time data the later the start location will appear on it. With this in mind, I can not emphasize the importance of controlling your athlete's pre-pull posture enough.
That said, guys like Professor Greg Haff (who essentially invented the IMTP) will often identify the IMTP start by eye. If you have his experience then go for it. Otherwise, follow the method I've just described. When applied to the countermovement jump (CMJ), Owen et al. explain that the odds of this method miss-triggering the start are 1 in 1,744 (when 1 second of pre-jump standing still force recorded at 1000 Hz is used). One of Professor Haff's PhD students has recently shown that there can be a significant difference between the location (on the force-time curve) and early-stage force-time metrics when the start is identified using different methods like those described above (you can find a poster of a paper by Stuart Guppy here).
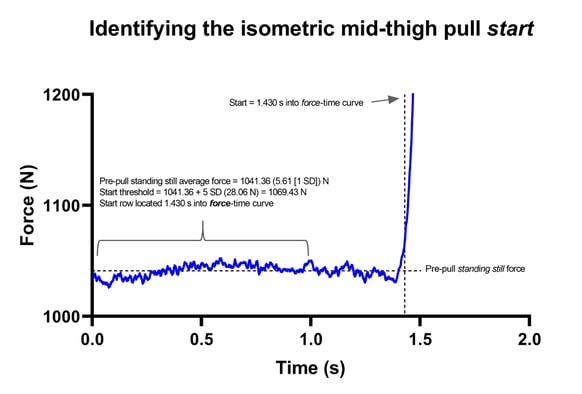
Figure 2. Identifying the IMTP starts using the 5 SD method.
So, that's the start (kinda) taken care of, what else could go wrong?
Well, as I touched on in the first article, how you calculate RFD, and the force-time data you collect it from can make your life really complicated (relatively, obviously). To give you a better idea of what I mean by this and in doing so hopefully reinforcing the importance of using consistent methods, I've calculated different RFD-based metrics, using different methods, from the same IMTP trial. For the remainder of this article I'll focus on RFD considering the following:
-
RFD calculated over the first 50, 100, 150, 200, and 250 ms by dividing the change in force during these periods by the time
-
RFD calculated over the first 50, 100, 150, 200, and 250 ms by averaging instantaneous RFD over these periods
-
Instantaneous RFD is where we calculate RFD on a sample-by-sample basis using the differentiation approach I mentioned in the last blog
-
The above were calculated from unfiltered (noisy) data, and data smoothed using a low-pass filter with different cut-offs (10 and 50 Hz - an extreme and not-so-extreme method) and by using a moving average over 10 and 40 windows (often-used 'windows' [data samples])
There are so many different other ways I could include, but I think the above is enough to paint the picture of potential data carnage.
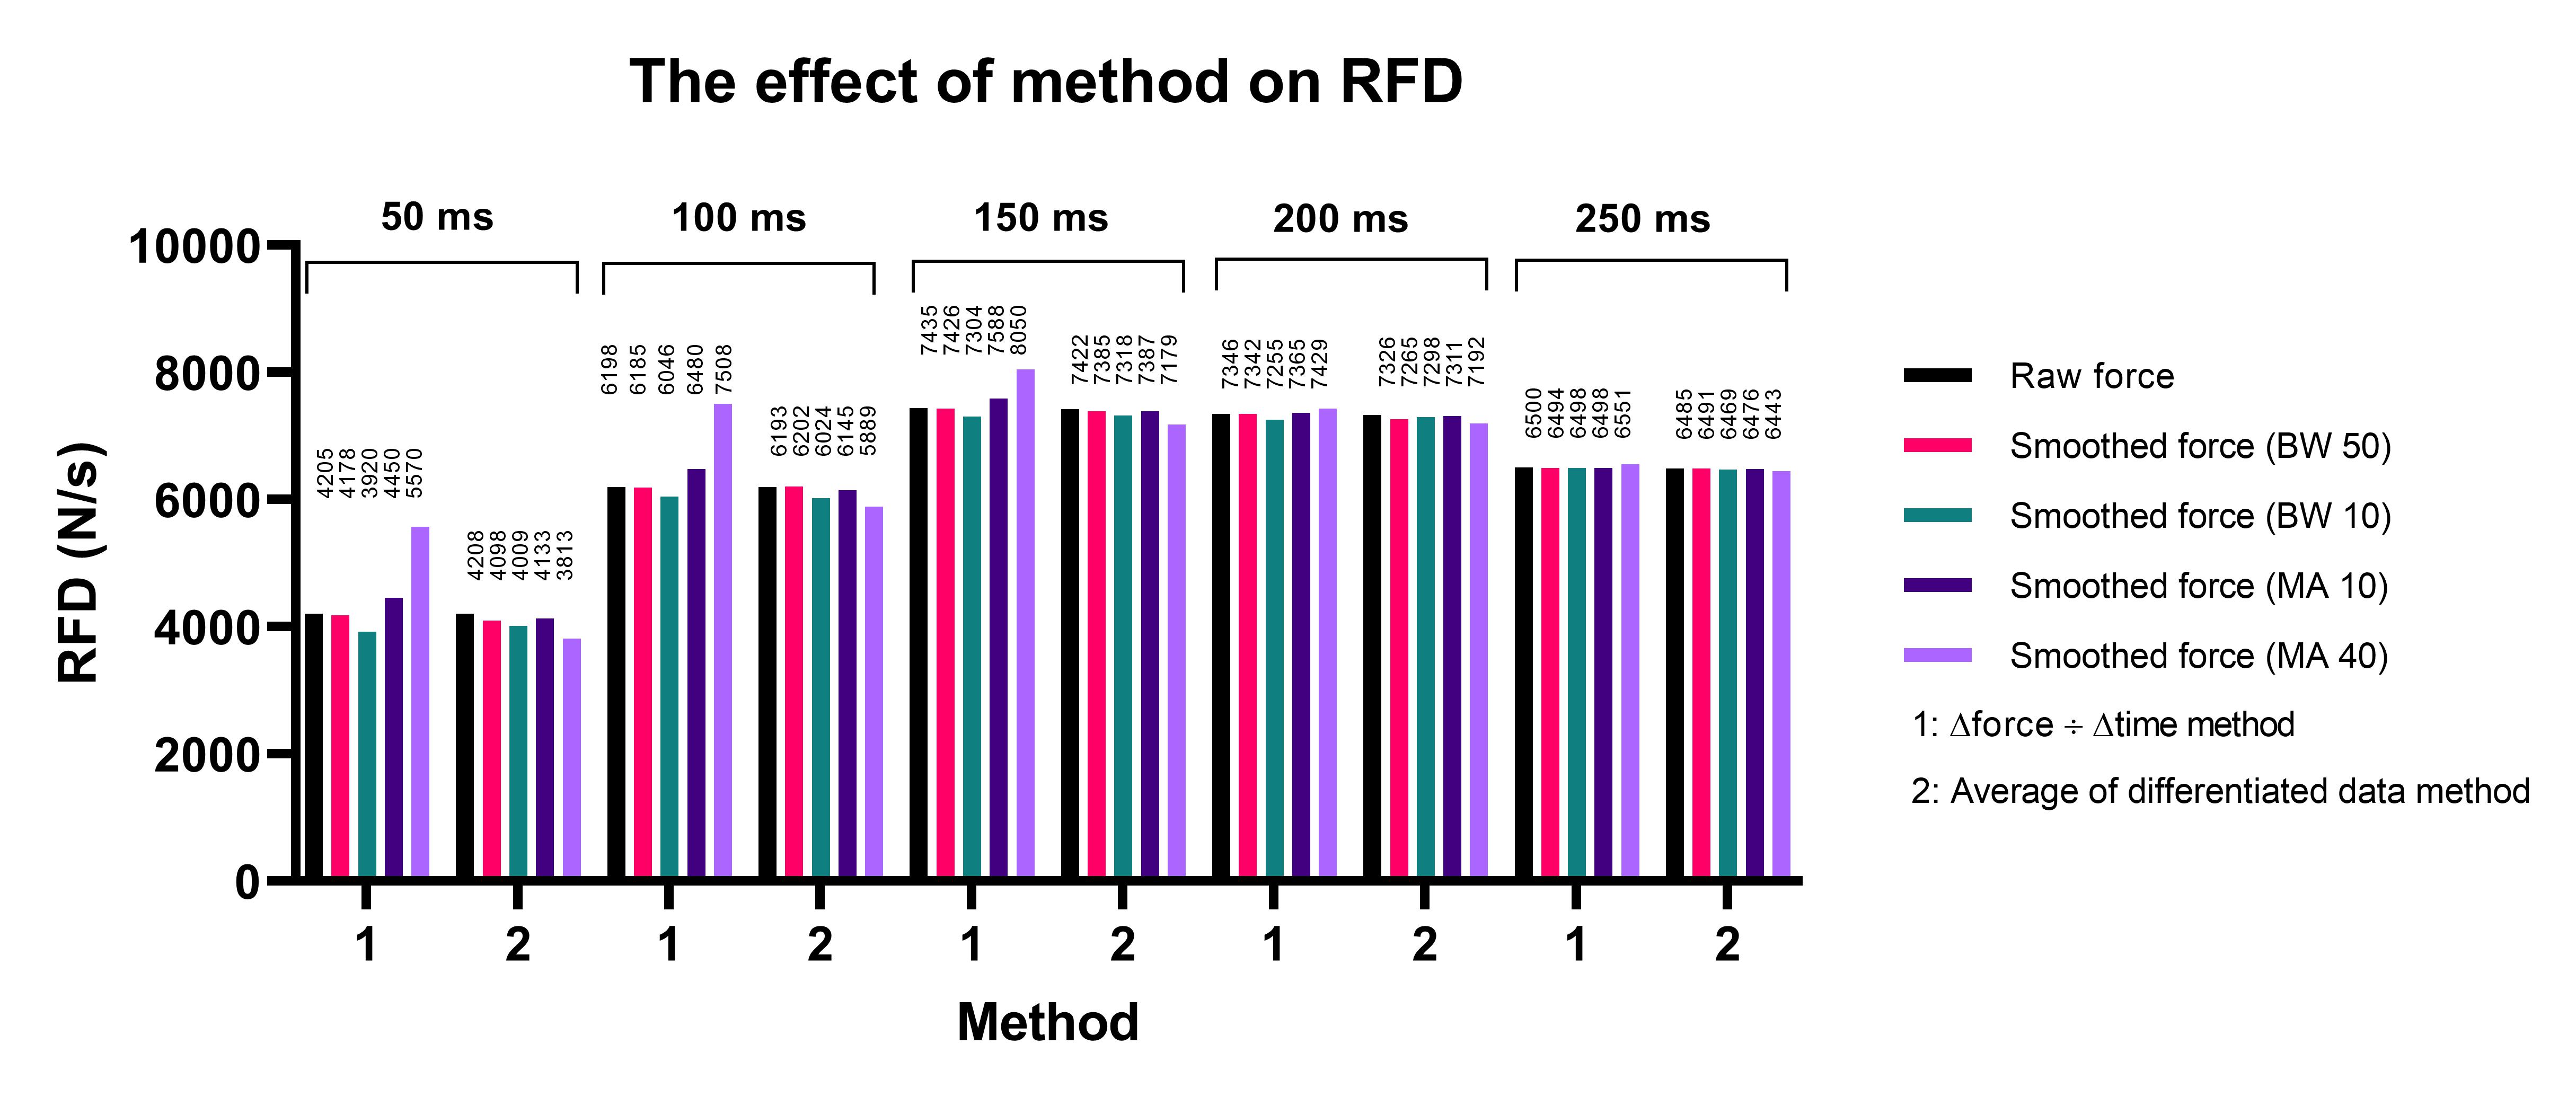
Figure 3. The effect that the different methods have on IMTP RFD data.
Results
Figure 3 shows RFD calculated during the first 50, 100, 150, 200, and 250 ms of the IMTP. I think it's important to note several things here:
-
RFD changes across the different time periods
-
How RFD is calculated (method 1 & 2) clearly affects RFD
-
The way data are filtered clearly affects RFD
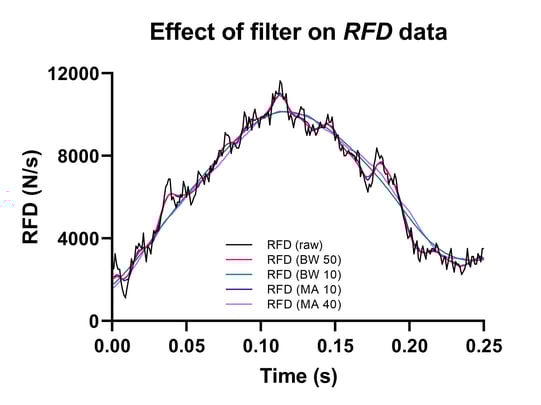
Figure 4. The effect that the method used to smooth our force-time/RFD data has on it.
The most important part: What does this all mean and what should you do?
So, with the data in Figure 3 in mind, what method would you choose? Some of you will be limited by the method used by your force plate system software. Figure 4 shows us that unfiltered RFD data is far too noisy (note its jagged nature). It also warns us of the potential perils of 'over-smoothing' our RFD data, with the two more 'aggressive' methods marking what might be considered too big a departure from the original RFD data. With that in mind, I'd be inclined to go with either the moving average applied over 10 windows or the Butterworth filter with a cut-off frequency of 50 Hz. An important point to note though is that if you find yourself using a different force plate system, or even collecting your data from significantly different surfaces this part of the RFD puzzle might need to be revisited. Remember that you must take ownership of the quality of your data where possible.
You might be thinking: "that's great, Jason but so what, what do these numbers mean and are there alternatives?" That's a really good question. We're not about creating problems without solutions here at Hawkin Dynamics, we want to make this stuff as accessible as possible for our users. With that in mind, here are some things you should consider and get on top of before you set sail on the good ship 'RFD'.
Take real ownership of whatever 'version' of RFD you use. What might affect RFD accuracy and repeatability? What time period is of interest and why? Do you notice a relationship between changes in an athlete's RFD over the 100 ms and their performance, be honest with yourself. This may sound like a bit of a cop-out, but there is no substitute for conscious data collection and experience here. Immerse yourself in the data. Understand what it's telling you and act accordingly.
Is RFD magically connected to any particular element of athletic performance? No. And anyone who tries to tell you otherwise is probably trying to sell you something. So remain vigilant. There is very little research out there that is able to realistically attribute improvements in athletic performance to an increase in RFD. In fact, I'd go as far as saying that this applies to all metrics. None of them are magic so try to apply your force plate testing holistically. Consider force data part of rather than the whole picture.
"You love impulse Jason, how about that then, can I calculate it from my IMTP force-time data?" Absolutely! Does it suffer the same limitations as those raised in point 2? Kinda, yeah. However, if you know the change in force (less the pre-pull standing still average force) then rather than dividing it by the time period you can multiply it. This gives you impulse. What can impulse give us? Well, we know that impulse is directly proportional to the change in velocity of the mass of interest. "But the IMTP is isometric so there isn't any movement." You're right. However, and I'm going to need you to stay with me for a few more sentences here, let's say we calculate impulse over the first 100 ms. Then divide it by the athlete's mass. What does this give us? It gives us the athlete's velocity capacity. This means, in theory at least, that if the athlete were to let go of the bar 100 ms after the start of the pull they would move with a velocity equal to the impulse divided by their body mass. This gives us a direct link between the metric and an important element of performance capacity. Is this magic? Nope. Remember, apply this holistically. Compare any changes in impulse with changes in actual performance.
Finally, RFD is all about finding out how much force your athletes can apply over time. This final suggestion might seem somewhat radical, but why not just consider how much force your athletes apply over time periods of interest? You'll have to take the pre-pull standing still force into account, perhaps their body mass too. But, if force at 100 ms increases relative to the pre-pull standing still period and the athlete's body mass then they can apply more force over 100 ms. For the last time, apply this holistically. Be the coach, the human connection between your athletes and their data.
All of the above can also be applied to dynamic tasks, like the static start vertical jump. What happens when we throw in the stretch-shortening cycle? Join me for the final part of this series where I'll outline, and hopefully share some solutions to, the problems with the CMJ and RFD.
Conclusion
RFD could be really useful. However, it might not be. The task our athletes perform and the way our RFD-type data is calculated can affect our data considerably. So... beware, invest your time and energy into learning how to collect good data, and how to decipher and apply your data. As always, please feel free to ask questions. And please, discuss these blogs. Don't worry about looking foolish. There's only one way to get better at this kind of thing and that's to learn by reading, listening, watching others, making mistakes, and reflecting. Your data will only be as good as the time and effort that you put into collecting and understanding them. It's worth the time and energy investment.