-2.png?width=156&height=60&name=Hawkin%20Logo%20(2)-2.png)
.png?width=300&name=RatioReport%20Materials%20(6).png)
.png?width=937&height=527&name=RatioReport%20Materials%20(13).png)
What is the Ratio Report?
Some metrics are calculations of two metrics, which often leaves the practitioner asking the question ─ which one of the two metrics changed to influence the calculated metric value? The paper titled, Ratio Data: Understanding Pitfalls and Knowing When to Standardise by Chris Bishop (2023) highlights the considerations when accessing ratio data.
The impulse ratio is a good example of this, as it is calculated by dividing propulsive net impulse (PNI) by braking net impulse (BNI). This leaves the practitioner with a calculated value that gives insight into the movement strategy for that specific countermovement jump (i.e. is this athlete more of a braking or propulsive dominant jumper) but also leads the practitioner to look deeper into the influences of specific metrics for a given jump.
The ratio report solves this and allows you to select two metrics of the same unit, and create a custom ratio to track changes overtime.
Just like any of our other reports, you have the ability to save the custom ratio (combination of two metrics) as a template for future use or to share with your staff.
.png?width=454&height=256&name=RatioReport%20Materials%20(1).png) Figure 2: PDF Printable White Background Reports from the HD Cloud Software
Figure 2: PDF Printable White Background Reports from the HD Cloud Software
🚀 Jump to ratio report suggestions at the bottom
Two Historical Ratios in Sport Science
As of right now, these two historical ratios below have their own reports, however we will be moving them underneath the Ratio report as Templates.
Dynamic Strength Index - DSI
DSI is calculated by dividing an output from an isometric strength assessment by an output from a jump assessment. Traditionally, this is the peak force from the Isometric Mid Thigh Pull (IMTP) and peak force from the Countermovement Jump (CMJ) without Arm Swing. Most researchers and practitioners use the IMTP and CMJ, however one could also use the Isometric Back Squat or Belt Squat as the strength assessment, and CMJ with Arm Swing or Squat Jump as the jump assessment. It is important to note that if you opt to use a different test than what the research suggests, the ratio values will be different and thus you will not be able to use the typical DSI training suggestions of <0.60 = Ballistic Training / 0.61-0.79 = Concurrent / >0.80 = Strength Training. (watch a video by Dr. Paul Comfort on DSI, or listen to a podcast here on all things Isometric training).
Peak force in the CMJ will occur in one of three phases/locations - braking phase, propulsive phase, or the point at minimum displacement between the two phases. When the DSI is calculated on the HD Software, it will automatically find the peak force from one of these three locations and use that for the calculation (learn more on peak force location here).
.png?width=1920&height=1080&name=RatioReport%20Materials%20(8).png)
Figure 3: Dynamic Strength Index report in the Hawkin Cloud App. On 12/8 there was a new Isometric test that was saved, thus the bar height increased and the ratio changed - represented as the yellow dot and line.
Eccentric Utilization Ratio - EUR
EUR is calculated by dividing the jump height from a CMJ by the jump height from a Squat Jump. This is historically used to give the coach insight into the stretch shortening cycle (SSC) capabilities of the athlete by comparing outputs from a test that is heavily SSC-dependent (e.g. CMJ), and one that is not so reliant on the SSC (e.g. SJ). For example, if an athlete has a CMJ jump height of 30 inches and SJ jump height of 25 inches they will have an EUR of 1.2 ─ considering the sport and position, this may be preferable. If the sport and position is reliant on generating force from a static position (i.e. swim start) then you would want to work on bringing up the SJ jump height value closer to that of the CMJ jump height value and getting the EUR value closer to 1.0 at competition time. (Read more on EUR here in this paper by McGuigan et. al, 2006).
There are limitations to this way of judging an athlete's SSC ability by this method alone, however, it is relatively simple to complete and has ample research backing it. It is of our opinion that there are now better methods of judging an athlete's SSC ability, especially with the availability of force plates and the ability to dive into strategy metrics, driver metrics, and force-time curve shape characteristics.
.png?width=1920&height=1080&name=RatioReport%20Materials%20(9).png)
Figure 4: EUR Report in the Hawkin Cloud App. The user selected a date range without a Squat Jump recorded before 4/26 on the left screen. On the right screen, the user started the data range at 4/26 and the Squat Jump from 4/26 is carried on for the ratio until a new Squat Jump is recorded.
Building YOUR Custom Ratio Report
.png?width=1920&height=1080&name=RatioReport%20Materials%20(4).png)
Figure 5: Report builder screen to start building a savable Template
It's important to first note that not all ratios will make sense for this report. Therefore, we have limited the ability to only make ratios that have the same units. You may use different test types in the ratio to generate the report, as long as the units are the same.
-
Peak Propulsive Force (Newtons): Peak Braking Force (Newtons)
-
CMJ Relative Braking Force (%): Iso Relative Peak Force (%)
-
Propulsive Phase (Seconds): Braking Phase (Seconds)
-
Avg. Relative Propulsive Force (%): Avg. Relative Braking Force (%)
It is also generally best if you use the metric that you anticipate to be larger as the first metric when you are building your report.
.png?width=1051&height=591&name=RatioReport%20Materials%20(15).png)
Figure 6: Generally place the metric that is larger on top (2), and the metric that is smaller on bottom. This will give you a more presentable ratio value.
Ratio Report Options & Insights
We sat down at Hawkin Dynamics and thought of potentially useful metric combinations. You can find these metric combinations below, along with insight into how you may use them.
.png?width=1920&height=1080&name=RatioReport%20Materials%20(17).png)
CMJ Ratio Options
Each of the examples below are for the countermovement jump (CMJ).
Phase Driver Changes
-
Propulsive Net Impulse / Braking Net Impulse (Impulse Ratio)
-
We report this metric for every CMJ, Drop Jump, and CMJ Rebound test
-
This ratio is useful to track changes in movement "driver" strategies for in-season or out of season when you are trying to elicit a change with training (i.e. eccentric training block)
-
Impulse is always a "driver" metric, however by creating this ratio it becomes a measure of strategy change
-
Avg. Propulsive Force / Avg. Braking Force
-
This one is similar to Impulse Ratio, however it does not take into account time - only force for each phase.
-
Since it is an average metric, it does account for the force sustained in each phase.
-
Use either Impulse Ratio, or this one, not both.
-
-
Force at Minimum Displacement / Peak Braking Force
-
Force at Minimum Displacement occurs immediately after the braking phase and before the propulsive phase.
-
A higher Force at Min. Displacement value sets an athlete up with a greater potential to increase propulsive force (and most likely impulse).
-
If propulsive impulses are higher, the athlete will jump higher every single time.
-
Thus, it makes sense to see if Braking Forces are "getting into" the moment at minimum displacement (i.e. Force at Min. Displacement)
-
If you have a value over 1.0 for this ratio, it would mean that the athlete is still increasing force at minimum displacement - or in other words, still increasing force into the propulsive phase
-
If you have a value under 1.0 for this ratio, it would mean that the athlete produced peak force in the braking phase, and most likely did not increase forces going into the propulsive phase (there could be some caveats to this, but only occasionally).
-
-
Peak Propulsive Force / Force at Minimum Displacement
-
Similar to the one above, however now we are looking to see if force at the moment of minimum displacement is still increasing in the propulsive phase, or if it topped out at minimum displacement (or topped out in braking).
-
There are no good or bad values for this, however, it is generally best if peak force occurs closest to the moment of minimum displacement or immediately after in propulsion.
-
For sports and positions that are more "propulsive" (i.e. basketball guards) peak force will generally occur in propulsion. Whereas, in a position that is less propulsive and more reliant on braking (i.e. hockey) peak force will generally occur in braking.
-
-
Phase Time Strategy Changes
-
-
Propulsive Phase Duration / Braking Phase Duration
-
You can choose to use phase durations as a percentage of the total movement, or the value represented in seconds.
-
The propulsive phase will almost always be longer than the braking phase.
-
-
Unweighting Phase Duration / Braking Phase Duration
-
You can choose to use phase durations as a percentage of the total movement, or the value represented in seconds.
-
The impulse of unweighting and braking will always be equal, however times will often be different.
-
-
Bilateral Asymmetry Strategy Changes
-
-
Left Avg. Braking Force / Right Avg. Braking Force
-
This is similar to tracking the CMJ metric "L/R Avg. Braking Force", however now we are looking at the two values separately instead of using an asymmetry equation to calculate the percentage
-
This will give you a nice view of how limb compensation changes overtime (which is bound to happen!).
-
-
Left Avg. Braking RFD/ Right Avg. Braking RFD
-
Similar to the one above, however instead of force - Rate of Force Development of each individual limb
-
-
Single Leg Asymmetry Capacity Changes
-
-
Single Leg - Left Avg. Braking Force / Single Leg - Right Avg. Braking Force
-
Tag the CMJ "Single Leg - Left" and "Single Leg - Right" and include these in the Template Builder when you choose metrics
-
This will give you a nice view of how limb capacity changes overtime.
-
-
Single Leg - Left Jump Height / Single Leg - Right Jump Height
-
Similar to the one above, however now we are looking at the outputs of both individual limbs
-
-
Single Leg - Left Countermovement Depth / Single Leg - Right Countermovement Depth
-
Similar to the one above, however now we are looking at displacement strategies of each individual limb (i.e. range of motion in each limb)
-
-
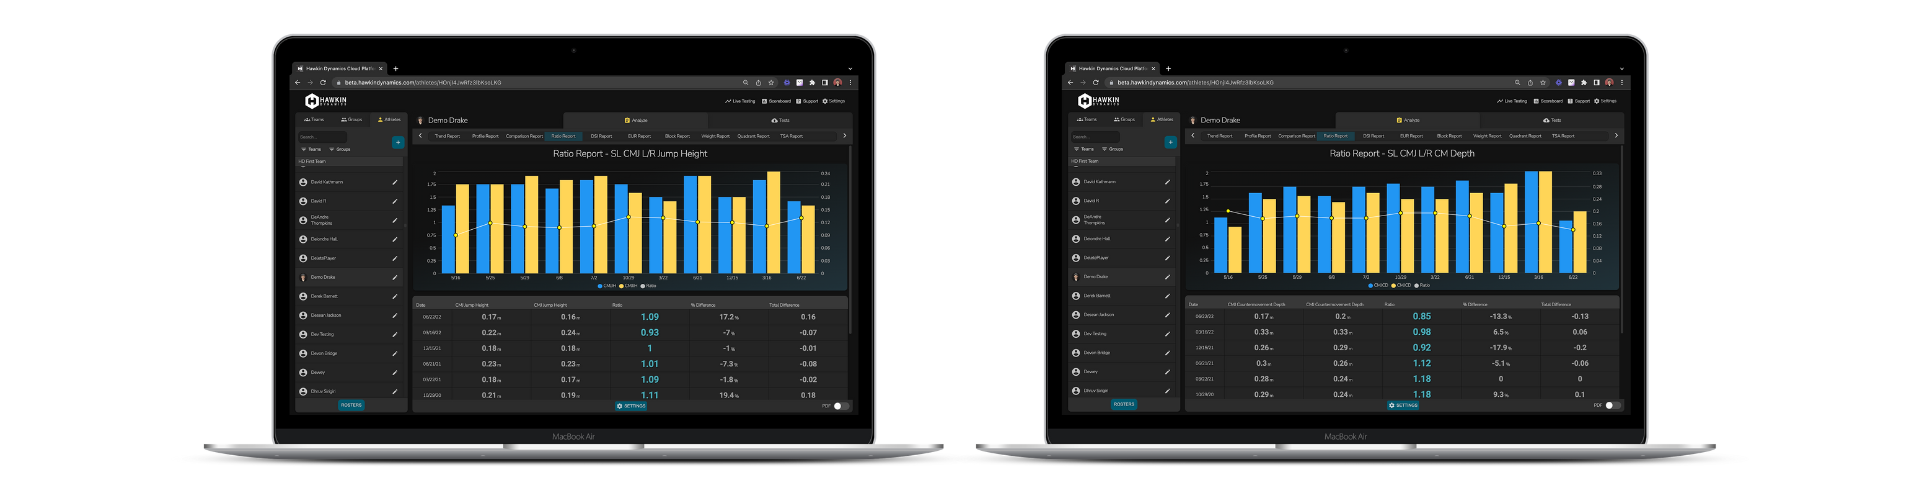
Figure 7: Single Leg Ratio Reports, Jump Height, and Countermovement Depth examples. Make sure to use tags if you want to visualize like this.
CMJ Rebound Ratio Picks
-
CMJ-RE Rebound Jump Height / CMJ-RE Jump Height
-
This ratio will provide insight into an athlete's braking ("eccentric") abilities.
-
An athlete with a high braking ability will be able to jump higher in the rebound jump.
-
A value of 1.0 or above would indicate that they jumped higher in the rebound jump, and thus have greater braking abilities.
-
You should still approach this with context, and make sure intent was provided during the first CMJ.
-
-
CMJ-RE Rebound Avg. Braking Force / CMJ-RE Avg. Braking Force
-
Similar to the one above, however now we are looking at braking forces instead of jump height.
-
The CMJ Rebound is an assessment of reactive strength, which is really measuring someone's braking ability and ability to redirect it. Watch a video of it here.
-
Isometric Ratio Picks
-
Peak Force / System Weight
-
This one is the metric "Relative Peak Force", but now shows both values and how they change the ratio overtime.
-
System weight will take into account any pretension that is occurring before the pull.
-
-
Force at _____ / Peak Force
-
By using one of the options below, you will get a ratio that tells you what percentage of peak force occurred at each millisecond mark. Choose the millisecond mark that best represents the time constraints of your sport.
-
Force at 50ms
-
Force at 100ms
-
Force at 150ms
-
Force at 200ms
-
Force at 250ms
-
-
You could also use Net Force at ______ / Net Force
-
.png?width=1920&height=500&name=Copy%20of%20RatioReport%20Materials%20(1).png)
Figure 8: Force at 150ms and Peak Force ratio for the IMTP. A value of .66 means that 66% of the peak force is occurring at the 150ms mark of the pull.
Squat Jump Ratio Picks
-
CMJ Propulsive Net Impulse / Squat Jump Propulsive Net Impulse
-
Similar to EUR, however now we are using a ratio of impulses instead of jump heights
-
Impulse is simply an area. Since its Propulsive Net, this means it is in the green phase and also above system weight ("net").
-
-
CMJ Propulsive Phase Duration / Squat Jump Propulsive Phase Time
-
Similar to EUR, now we are only looking at the time it takes to complete the propulsive phase of each (i.e. "push away from the plate").
-
You can choose to use phase durations as a percentage of the total movement, or the value represented in seconds.
-
Need Help?
If you are looking for help setting up this report, contact techsupport@hawkindynamics.com
If you have specific questions about the ratio options above, contact drake@hawkindynamics.com
.png?width=1920&height=1080&name=RatioReport%20Materials%20(11).png)
Figure 9: Image of the Ratio Report in the Hawkin Cloud App with a see-saw overlaid to represent the constant fluctuation in ratio metrics. It's best to look at ratio metrics over a period of time and with the context of what is happening in the athlete's sport and training schedule.