.png?width=300&name=Block%20Report%20Materials%2082022%20(13).png)
.png?width=780&name=Block%20Report%20Materials%2082022%20(13).png) What is the Block Report?
What is the Block Report?
The block report is a simple report that can be used to quickly assess whether an individual has improved between two dates. It resembles a table in Excel, and is used to answer a basic question...did the individual improve?
 Flagging color parameters are set by the user under-report settings > template settings. The direction of the arrow indicates which way the metric moved, up or down. A metric can move up (i.e. improve) and still be red if the parameters are set below the improvement. For example, using Jump Height one might set +1% as red when comparing an individual's Jump Height from Year 1 to Year 4 where you would expect Jump Height to improve by more than 1%. In this case, Jump Height improved, but not to the level we expected - therefore showing red.
>>Build Your Block Report Walk Through Video
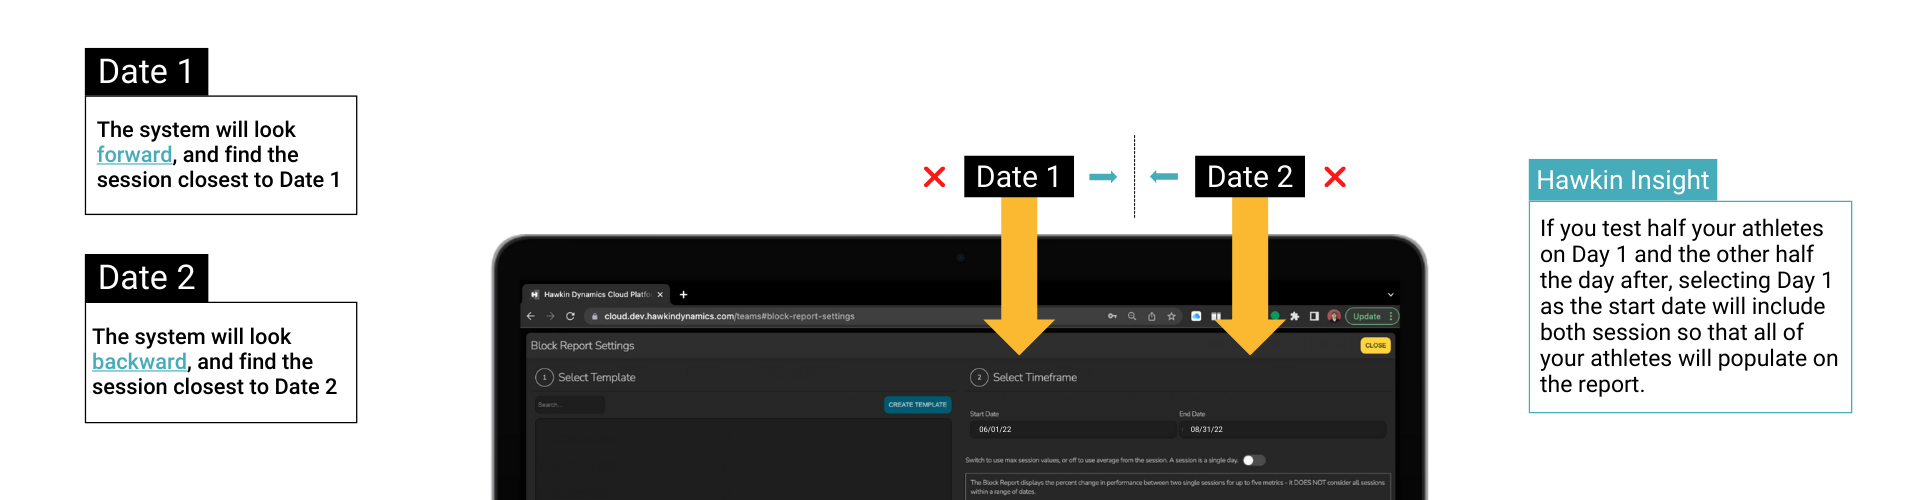
Half my athletes jumped the day after Date 1...
Block Report context...
Training, since its inception, has been dedicated to the pursuit of improving physical performance and skill. Periodization has subsequently subdivided training seasons into various "blocks" of training known as Micro-, Meso-, and Macro- cycles. This subdivision has created clear feedback loops, which serve as a formalized time window to prioritize the development, evaluation, and refinement of training stimuli.
.png?width=780&name=Block%20Report%20Materials%2082022%20(11).png)
Historically, training programs have focused on Output Metrics, such as a one-repetition maximum, to validate the training program's efficacy for developing maximal strength. Training programs that consistently reproduced favorable adaptations were repeated and built upon, while programs that failed to produce were discarded – it is an ever-evolving process.
The need for the deeper evaluation of a training block, which includes looking beyond just the Output Metrics (learn more about the ODS System for classifying metrics here), is crucial for the success of every sports team and every individual in training. Current market solutions have not adequately provided meaningful solutions for granular assessments of metrics (i.e. Driver, Strategy) which underpin meaningful biological adaptations. Our Performance Team at Hawkin Dynamics felt an obligation to fix this problem by creating a succinct and efficient analytic dashboard for our users - enter the Block Report.
.png?width=780&name=Block%20Report%20Materials%2082022%20(16).png)
Ethos and Overview
The ethos of the Block Report is to give practitioners a real-time snapshot of metrics that an organization values from any of the Hawkin Dynamics test types (review HD Test Types here).
This report can be used in many situations, including but not limited to...
-
Trend monitoring - mid block, are the individual's responding like you thought?
-
Identifying non-responders - using the team view, which individuals are red and which ones are green considering that they are all on the same training plan
-
Showcasing improvements to a sports coach or administrator - using a team view or group, select 1-2 metrics and show who the best responders are among the team...who improved the most this off-season? (we suggest using 1-2 metrics when presenting to a nonperformance professional)
-
Showcasing improvement in the return to play process - using the individual view compare the start of injury return date to the current date in the rehab process to show improvements to sports medicine or the individual. Individual limb force and time metrics are best used here, for example - Left average braking force.
Let's Get the Conversation Started...
The Block Report can also serve as an easy conversation starter with other key stakeholders (i.e. sports coaches, sports medicine, or parents) on highlighting trends in performance to the team, group, or individual's development. By creating templates, one can choose metrics that are suitable for the population you are presenting to, providing multiple lenses for analyses.
Overview
-
Custom start dates allow practitioners complete control and flexibility when transitioning training priorities and focus.
-
Percentages represent improvements or decrements between two session averages, or session maximums (best of multiple attempts on that day)
-
Color coding (with custom parameters) allows a user to immediately identify large changes between the two dates for a team, group, or individual.
-
The ability to select 1 metric, or up to 5 metrics allows a practitioner to designate the KPI in column 1, and supporting driver and strategy metrics in the remaining columns.
.png?width=1920&name=Block%20Report%20Materials%2082022%20(12).png)
.png?width=780&name=Block%20Report%20Materials%2082022%20(14).png)
.png?width=1920&name=Block%20Report%20Materials%2082022%20(15).png)
Insights from Hawkin Performance
.png?width=1920&name=BlogPerformanceHeaders2022%20(1).png)
Athlete development occurs at the individual level. Training intensities, volumes, and frequencies are highly sensitive variables that change daily. This report provides an excellent platform for conversation with head coaches and position coaches about an individual's status. This report is ideal for the "How are they doing?" conversations. This report provides a framework and context to answer this question precisely. Especially during in-season training cycles, training objectives can feel like everything needs to get better all at once, and it should have happened yesterday. This frantic one-size-fits-all approach, which typically results in higher intensities than required, doesn't typically lead to optimal long-term development – you can’t bake a cake in half the time by doubling the heat. This report allows every shareholder a voice to articulate what is most important for the short term and clarify its impact on the long-term success of the individual. Once all parties agree on the training emphasis and the length of the training block, the report will automatically update, allowing near-real-time insight for all parties involved. I would recommend that teams design a template for this report to individually monitor someone's progress through a block and one template designed as a safety net team-wide to ensure outputs aren't developed at the determinant of known safe loading strategies.
Potential Metrics for Strength Plan - Things we would expect to improve over time
-
Force at Minimal Displacement
-
Peak Relative Braking Power
-
Relative Force at Minimal Displacement
-
Braking Net Impulse
-
Propulsive Net Impulse
Potential Safety Net Metrics - Metrics that, regardless of the plan, we don't want to see deteriorate
-
Relative Peak Landing Force
-
Left Right Peak Landing Force %
-
Left Right Peak Propulsive Force %
-
Left Right Average Braking RFD

Gauging performance improvement over time for specific groups has typically been quite an arduous process from a data management standpoint. The Block Report is particularly advantageous when highlighting changes in a diverse group of athletes or clients with different needs. Taking an individualized athlete (client) development approach you can now tailor your analysis to your programming. For instance, if you have highlighted pure strength as a target area for an athlete or client's development and as a practitioner you have developed a training program that is focused on pure strength development, you can now build a template suitable, choose a range of dates from the start of the program and effectively audit the success of your programming for that individual athlete (client). You can answer the simple question: Is your program having the desired outcome for the individual? If not, make adjustments and repeat the process. If yes, you can choose to continue to develop that same target or change targets and develop a new template to monitor progression.
This process can be completed across multiple areas. Design templates that fit certain groups (sporting positions, age groups, or injuries), and also different types of development from strength, power, unilateral, or upper vs lower body analyses.
The simplicity of this report when coupled with the agility of our software being able to move up and down the chain from team to group to athlete, while simultaneously being able to quickly select specific templates makes this report usable from 10,000 feet all the way down to 1 foot. It is all about progress, development, and program auditing so you can learn more about your athletes and clients while developing and redeveloping specific training programming. It is all in your hands.
In terms of metrics. It is very specific depending on what you wish to achieve. You can certainly talk to me or one of the team at any stage to assist in building templates and individualizing your program. To start, these metrics below give you a great foundation or broad-stroke approach for the analysis of holistic player development. Once you have mastered the use and understanding you can begin to branch out into more user specific metrics.
Holistic Development Metrics:
-
Jump Height (or Take Off Velocity)
-
Countermovement Depth
-
Braking RFD
-
Average Propulsive Force
-
Propulsive Net Impulse
-
mRSI
-
Relative Peak Landing Force
These metrics give you a general understanding of each phase within a CMJ, the driving factors, the strategy, and then the actual outcome which includes both the performance and then landing. Feel free to contact me on the link below to walk through some of the application.
Want to schedule a time with James Hanisch to design a template for your program?
.png?width=1920&name=BlogPerformanceHeaders2022%20(2).png)
Physical preparation programs must be designed to improve the physical characteristics that underpin our athletes' key sporting performance indicators (KPIs) – it is not about making our athletes look good in the gym, it is about helping them win on game day. From an evidence-informed perspective, we must ensure that the performance assessments we are conducting, and the metrics we are selecting from them, appropriately represent the physical characteristics we think they are. Whether we use a causal or teleological approach, if the selected metrics are not improving concurrently with our KPIs, we must take time to conduct a postmortem, reflect, and identify where and why we have failed to have an impact. What is the point of developing something that doesn’t matter? Conversely, if our physical preparation program is improving the relevant physical characteristics, it is important to look inward and identify where and why we have had an impact - it’s time to trim the fat. Further, it is not just about if the athlete has improved during a training block, it is about if the athlete has improved at the right time and can perform on the right day, which is game day. This is where The Block Report comes in. Not only does The Block Report allow us to perform a postmortem of our physical preparation program at the macro-cycle level, but it also allows us to make changes in real-time at the meso- and micro-cycle levels, too. In the age of technology, you can’t do things the way they have always been done. You can’t just deliver your physical preparation program and hope it has achieved what you intended; you must know. The Block Report will tell you.
Regarding CMJ metrics for The Block Report, I recommend using the ODS System to gain a holistic understanding of the changes observed.
Output Metrics:
-
Jump Height
-
Jump Momentum
-
mRSI
Driver Metrics:
-
Braking RFD
-
Braking Net Impulse
-
Force at Minimum Displacement
-
Average Propulsive Force
Strategy Metrics:
-
Time to Take Off (or broken down into the individual phase times)
-
Countermovement Depth
Individual Limb Metrics:
-
Left Average Braking Force
-
Right Average Braking Force
Conclusion
Regardless of the metrics you select for the Block Report, designing optimized training programs for individual development is the key. We hope that this report not only confirms what you believe to be true, but also gives you new insights that you have never seen before.
New to Hawkin Dynamics and interested in a virtual demo?

.png?width=290&name=Untitled%20design%20(53).png)