-2.png?width=156&height=60&name=Hawkin%20Logo%20(2)-2.png)
.png?width=300&name=Jason%20Pedley%20Blog%202023%20(1).png)
Introduction
Most coaches routinely test their athletes to determine training objectives and training effectiveness. Drop jumps are a common component of any sports performance testing battery due to their reported associations with sprinting and change of direction ability, endurance performance, strength, and the fact that they possess a huge amount of face validity for general explosive qualities.
-1.png)
Figure 1: Force-time curve for a Drop Jump in the Hawkin Dynamics software
What do we measure in a drop jump?
Common sense tells us that how high an athlete jumps is of obvious importance in a jumping test. Since the drop jump is a rebound task, the ground contact time is the other outcome that we use to assess performance. As we humans are simple creatures, we like to reduce these two metrics into a single variable to measure plyometric performance: reactive strength index.
Reactive strength index (RSI) offers little insight into training objectives for an athlete; at the very least we need to know the component parts. If we bake a cake, but it doesn’t taste right, we need to know the recipe to see what could or should be changed. Take the two athletes below as an example; they achieve the same reactive strength index but through very different means and therefore training requirements would likely be very different. Similarly, these could be two trials by the same athlete- which is better?
.png?width=706&height=397&name=Jason%20Pedley%20Blog%202023%20(1).png)
Figure 2: Visual of the same RSI value produced in two different ways. Athlete B spends more time on the ground yet jumps higher.
Limitations to the RSI approach
Here comes the finger-wagging we’ve become accustomed to from the countermovement jump crowd; “outcome measures are important, but how they were achieved is more important”.
Before thinking about what we should measure, we need to take a step back and ask ourselves why we are doing drop jumps in the first place. Are we interested in an athlete’s ability to jump as high as possible, quickly? Of course, but I would argue that isn’t the primary objective: that’s what CMJs are for. Drop jumps are about assessing or developing your athlete’s ability to use the fast stretch-shortening cycle to jump high quickly. The latter is possible in the absence of the former and so when we interpret drop jump ability, we need metrics that give us insight into not only the performance outcomes, but also the underlying mechanisms used to achieve those outcomes.
“Here comes the science bit- concentrate!”
The stretch-shortening cycle facilitates rapid force production through several underpinning mechanisms including storage of elastic energy in connective tissues, activation of the stretch reflex, and subsequent neural potentiation and recruitment of fast-twitch motor units. Blickhan’s spring-mass model simplifies this very complex process to suggest that during rebound tasks, the human leg could be modeled as a spring that is compressed during the braking phase of ground contact and recoils during the propulsive phase. In an efficient system with no loss of energy, this produces a bell-shaped vertical ground reaction force that is the mirror image of the vertical centre of mass displacement; peak force occurs at the same time as peak compression of the leg. We can calculate the extent to which vertical force is related to vertical displacement by performing a Pearson correlation between these two variables; perfect spring-like behavior produces an outcome of -1.0.
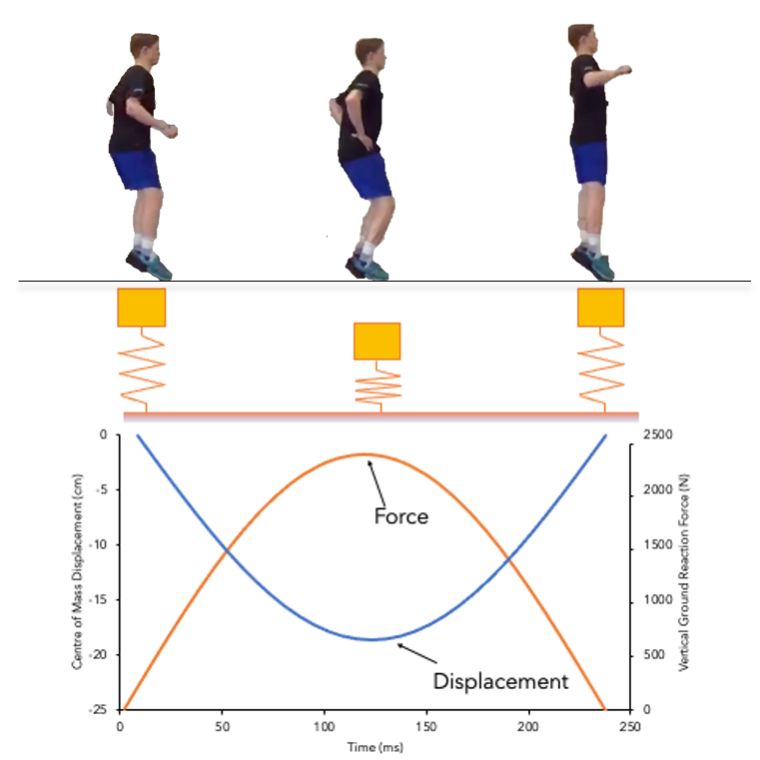
Figure 3: Spring-like correlation in a human model, a value of -1.0 is the highest achievable value.
When the association between vertical force and displacement deviates substantially from -1.0 (> -0.8) then it is also common to see a substantial impact peak. Impact peaks in running studies are typically observed within the first 20% of ground contact which in a drop jump is usually in the first 50-60ms. This is in line with the response time of the long latency stretch reflex and the estimated time of ACL failure. These impact peaks suggest diminished dampening mechanisms that maintain tension on the tendon and store energy into active and connective tissues; potentially dissipating this energy into passive tissues. Using the spring-like behavior (-0.8 < r > -1.0) and the presence of an impact peak (peak landing force within the first 20% of ground contact time), we can categorize the stretch-shortening cycle function as below.
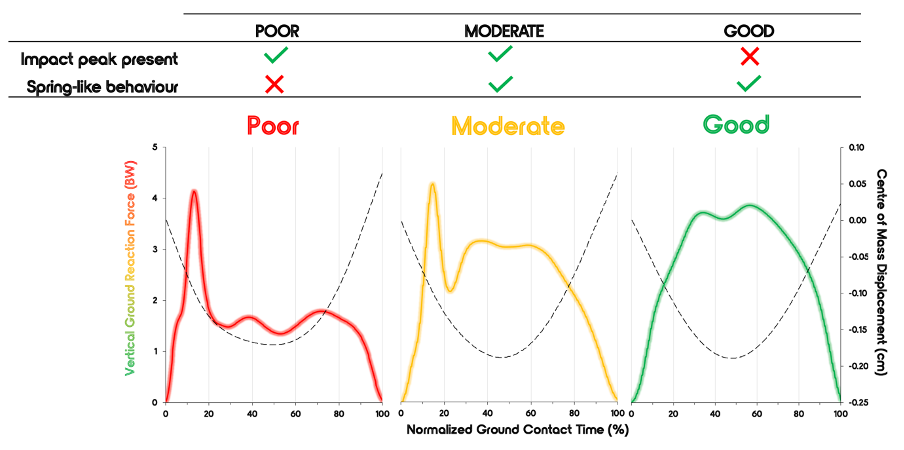 Figure 4: Impact peak force-time curves from a Drop Jump. If an impact peak occurs, peak force occurs within the first 20% of contact time.
If we look at the center of mass displacement curve for ‘poor’ we can see a flattened bottom to the ‘U’ shaped parabola. This might suggest an eccentric-concentric decoupling and lengthening of the amortization phase. In contrast, the parabola for ‘good’ has a sharper looking bottom suggesting the change from flexion to extension is much quicker. ‘Good’ is perhaps unsurprisingly then associated with better performance outcomes, particularly enhanced reactive strength index primarily through a reduction in ground contact time. So why overcomplicate matters with all of these ground reaction force variables if they just reflect what the reactive strength index already tells us? Well, while the ‘good’ function is associated with better performance, we can still see good performance outcomes in the absence of a good stretch-shortening cycle function.
A Tale of Two Drop Jumps
If we go right back to our rationale for performing plyometrics, we want high-performance outputs facilitated by the stretch-shortening cycle. Look at the two examples below from adult male elite soccer players.
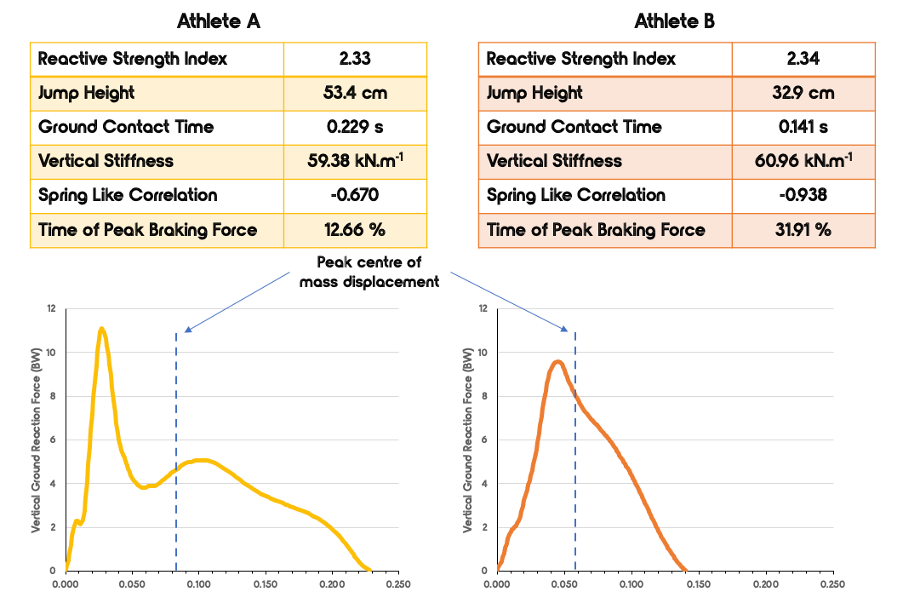 Figure 5: Comparison of two athletes with a nearly identical RSI value, however very different strategies.
Athlete A and Athlete B have identical reactive strength scores and we would consider these to have very good plyometric ability. However, using the categorization system presented above, Athlete A has ‘poor’ stretch-shortening cycle function while Athlete B has a ‘good’ function. So how does Athlete A still achieve such impressive RSI outcomes? We can see that the peak center of mass displacement occurs relatively early during ground contact with a long application of impulse in the propulsive phase. The magnitude of force during the propulsive phase is relatively low compared to the peak force experienced during the braking phase. This would suggest that the braking phase is not augmenting the propulsive phase as we would expect if the mechanisms of the stretch-shortening cycle are working effectively. In contrast, Athlete B has a peak center of mass displacement close to the mid-point of ground contact and the magnitude of the force is much greater at peak displacement. This suggests a better transfer of energy from the braking to the propulsive phase to allow greater force production throughout the propulsive phase.
Which variables should we be looking at, and which don’t tell us much (on their own)?
Peak force
It is important to remember what the equipment we are using measures. Force plates merely measure the magnitude of force applied to a surface, over time. What they do not measure is force generated by the muscular system. Some of the force applied to the surface of the force plate will be the result of muscular contractions, but not all of it. An inanimate mass, dropped onto a force plate, will register a lot of force because of Newton’s second law (F = m*a). Peak forces registered in the very early phase of ground contact time are likely a reflection of a passive collision between the athlete and the force plate than large forces generated by the neuromuscular system. It is important to look at when those forces are occurring in order to make insightful judgments about the contribution of those force peaks to function and performance.
In the Hawkin Dynamics system, this would be the Peak Braking Force for the Drop Jump, or Rebound Peak Braking Force for the Countermovement Rebound (a hybrid CMJ and Drop Jump assessment)
Rate of force development
Being able to develop force quickly makes intuitive sense as an objective within drop jumps. Therefore, measuring the rate of force development (RFD) and attempting to increase RFD would make sense. However, if we look at our two example athletes again, we can see that based on the gradient of the rising edge for each athlete: Athlete A would have the greater RFD. As outlined above, this is likely more of an undesirable passive collision. For this athlete we would want to change the landing strategy to remove this impact peak which would transition the athlete to a profile with a shape more similar to Athlete B. In this instance, a reduction in RFD would be a positive change. On the other hand, the objectives for Athlete B would be to narrow the force-time curve and increase the amplitude of the curve. This would steepen the rising edge and cause an increase in RFD. So, putting aside the noise associated with measuring RFD, we need to know more information about an athlete’s force profile to determine whether an increase or decrease in RFD is a positive change.
In the Hawkin Dynamics system, this would be Average Braking RFD for the Drop Jump
Vertical stiffness
Prof Jason Lake frequently encourages caution when using black box force plate analytics. Vertical stiffness is a good example of why this caution is warranted. Vertical stiffness is calculated by dividing peak force by the peak displacement of the centre of mass. An often-overlooked assumption of performing this equation is that the athlete should be demonstrating spring-like behaviour, which would then mean peak force and peak displacement occur at the same time. As you can see from the example athletes above, they have almost identical vertical stiffness values, but we can see that peak force for Athlete A happens much earlier than the peak centre of mass displacement. Athlete A initially lands very stiff but then quickly becomes compliant as we see force reduce dramatically as the leg flexes during braking. So, don’t dismiss vertical stiffness but check that the assumptions of spring-like behaviour are satisfied first.
So, what should we be looking at? The table below provides a guide to some important variables that allow us to screen functions before then assessing performance. It is important to underline that in isolation these variables are meaningless. There is no point having a great spring like correlation if you are a soft, compliant spring. There is potential value in having performance without function, but this might have injury risk implications and will also likely reduce the ceiling for performance improvements and transference of plyometric ability into other tasks.
In the Hawkin Dynamics system, this would be spring like correlation, impact peak, time to peak braking force, contact time, stiffness, jump height, and RSI for the Drop Jump. For the CMJ Rebound, it would be rebound spring like correlation, rebound impact peak, rebound time to peak braking force, rebound contact time, rebound stiffness, rebound jump height, and rebound RSI
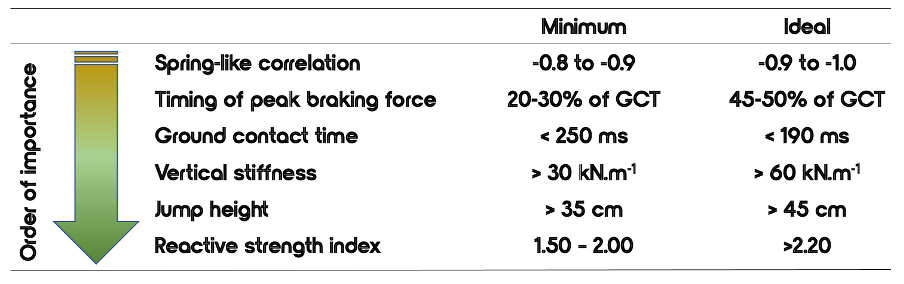
Figure 6: Normative values to aim for when assessing someone's reactive ability, and strategies taken to achieve reactivity.
Further Reading
-
Pedley, J.S., et al. (2020). A novel method to categorize stretch-shortening cycle performance across maturity in youth soccer players. J Strength Cond Res 39(9): 2573-2580. (LINK)
-
Pedley, J. S., et al. (2021). Maturity alters drop vertical jump landing force-time profiles but not performance outcomes in adolescent females. Scand J Med Sci Sports 31(11): 2055-2063. (LINK)
-
Follow Dr. Jason Pedley on Twitter
More Drop Jump & CMJ RE Resources
Video of a Drop Jump on Hawkin Dynamics force plates.
Video of a Countermovement Rebound on Hawkin Dynamics force plates.