-2.png?width=156&height=60&name=Hawkin%20Logo%20(2)-2.png)

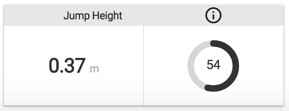
Analysis of the athlete’s selected countermovement jump data point indicates that they jumped 0.37 m. Compared to the selected population this jump height would give the athlete a score of "54".
The score of "54" is based off of how many standard deviations away from the population mean the athlete's metric was. "54" is an adjusted z-score number out of 100. The image below shows how the value is calculated:
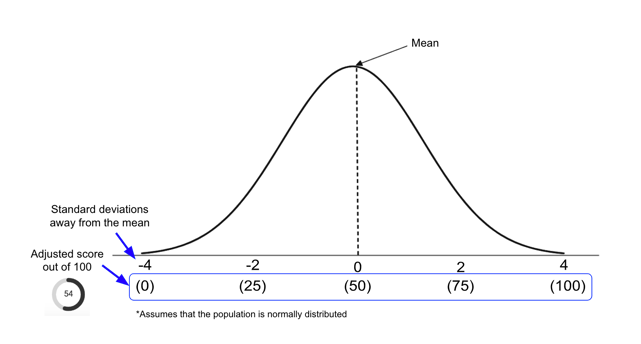
Therefore, the value of "54" indicates that the athlete's value was very close to the population mean of "50".
Practical use of this scoring feature would indicate that the athlete's jump height was an average jump height for the population comparison.
Population Size
Population size should always be considered when comparing the selected athlete. A larger population size will allow for a more robust assessment.
Population size can be seen on the far right. This is the sample size that the score is drawing the comparison to.