-2.png?width=156&height=60&name=Hawkin%20Logo%20(2)-2.png)

Now, with owning a great force measurement system comes great responsibility.
This might be getting old now, but responsibility is one of the keywords with this kind of thing: if you want to maximize the quality and utility of your force data, then you really must take responsibility for it.
.png?width=272&name=Clean%20tablet%20(3).png)
We’ve discussed the importance of this regarding the metrics you choose to ‘tell your athlete’s story’ in past blog posts (and we will be diving more deeply into other aspects of this). We’ve also discussed some of the processing elements that can affect the quality of your data. However, in this article, I want to take us back to basics and consider perhaps the most obvious and so often overlooked element: the surface you put your force plates on.
Drake and I want to walk you through why this is so important before we go on to explain how the ground we put our force plates on can affect how we identify take-off, which, of course, is pretty important if we’re interested in studying metrics like jump height, phase duration, and modified RSI.
So, it should be obvious that one of the first things we have to do with our force plates is set them up. And, of course, this means finding somewhere to physically place them on. The problem is, however, that the floor surfaces force plate users have access to will vary on a coach-by-coach and perhaps day-by-day basis.
Now, I just mentioned Drake, and for those of you who don’t know him, let me take this opportunity to introduce him. Drake Berberet is not only a nice fella, but he’s also super-bright and an integral part of the Hawkin Dynamics family. And he’s a coach with access to a lot of the different surfaces many of you will be familiar with, so he went off and collected a ton of countermovement jump (CMJ) force data using his Hawkin Dynamics system.
A more detailed explanation of the method and images of the testing surfaces can be found at the end of this article.
Testing Surfaces
-
AstroTurf
-
Baseball Dirt (behind home plate)
-
Basketball Court
-
Concrete Flooring
-
Foam Flooring (½ inch thick, weight room foam tiles)
-
Grass (quite long grass)
-
Tennis Courts (Tarmac)
-
Track Flooring (synthetic rubber)
-
Field Turf
-
Rubber Weight Room Flooring
To try and illustrate the effect that floor surface can have on CMJ force plate data, we've focused on the following metrics:
-
Pre-jump quiet standing force (force averaged over one second of standing still before the jump begins)
-
Pre-jump quiet standing standard deviation (the variance of the force during this one-second period)
-
The middle 50% of flight mean (force averaged during the middle 50% of flight)
-
The middle 50% of flight standard deviation (the variance of the force during the middle 50% of flight)
-
Take-off threshold (the force value used to indicate take-off)
Results
So, what did we find? Well, check out Table 1, which shows us that, yes, perhaps unsurprisingly, the surface you set your force plates on will affect your data. Yes, it might be obvious, but something obvious doesn’t help you when you’re trying to maximize the quality of your force plate data.
Table 1. The effect that floor surface had on mean and standard deviation (SD) quiet standing and middle flight phase force and the take-off thresholds.
|
Surface |
Quiet Standing Mean (N) |
Standing Still SD (N) |
Middle 50% Flight Mean (N) |
Middle 50% Flight SD (N) |
Take-Off Threshold (N) |
|
Concrete |
843.1 |
1.6 |
1.1 |
3.9 |
20.8 |
|
Astro |
834.6 |
1.4 |
-2.1 |
21.1 |
103.1 |
|
Basketball |
847.1 |
1.7 |
0.5 |
4.6 |
23.4 |
|
Baseball Dirt |
847.4 |
1.3 |
0.4 |
4.6 |
23.5 |
|
Foam |
836.4 |
1.3 |
-0.8 |
22.0 |
109.0 |
|
Long Grass |
591.6 |
1.5 |
2.4 |
6.7 |
36.0 |
|
Tennis Court |
843.9 |
2.3 |
1.8 |
4.9 |
26.3 |
|
Track |
841.1 |
2.1 |
-0.2 |
7.2 |
35.5 |
|
Field Turf |
846.9 |
1.4 |
-0.4 |
18.3 |
91.3 |
|
Weight Room |
846.5 |
2.0 |
0.7 |
4.6 |
23.7 |
Discussion
Drake collected this data over two days, so I think it’s reasonable to assume that he didn’t lose the weight that would be necessary to explain the differences shown during the pre-jump quiet standing. Let’s take concrete as our ‘gold standard’ surface here. Look at how grass and foam affect the force data… wow! This is a big deal, with differences of up to 30%.
You could be forgiven then for formulating the following actions based on this quick perusal of Table 1: don’t put my force plates on foam or grass, and I think that would be reasonable. However, my inner nerd implores you to keep on scanning from the left to right of the table.
Look at the monstrous (yeah, that’s a well-known statistics term) flight phase standard deviations. More importantly, look at the effect they have on the take-off threshold: the point we identify to calculate metrics like jump height, phase duration, and RSImod.
‘So what?’ you might be thinking. Well, we need to dig out that whole taking responsibility thing again (sorry!). This is because, depending on the force plate system you’re working with, the effect that the ground surface has on the take-off threshold could make a complete mockery of your force plate-derived jump metrics.
Don’t despair, though. If you’re using our Hawkin Dynamics force plate system, then well done, you, you made a very good choice. And yes, of course, we’d say this, but let me back up what perhaps seems like a bold, maybe unfair claim.
So, the reason we consider the mean and SD flight force is that this enables our software to adapt the take-off threshold according to the circumstances the user finds themselves in. This means that if, during one session, we’d recorded our data on concrete, then our take-off would be identified as the first force value less than 20.8 N. If we find ourselves on field turf the following week, we’ll see that our software can adapt to this because it will identify take-off as the first force under 91.3 N.
This is important, and, once again, while it’s why we at Hawkin Dynamics will always do our best to help you get the most accurate and useful data possible, it should serve as another reminder: take responsibility for the quality of your data. Please trust us when we say that it’s worth every ounce of time and energy you put into this.
Using another force plate system?
Of course, many of you could be using different systems. If that's the case, I would strongly urge you to ask the company how they identify keep points like the start, phase transitions, and the take-off. If they don't tell you, they've probably got something to hide, and that isn't a good thing.
Summary
-
Try to position your force plates on as solid, level, and flat ground as possible.
-
Try to make sure that you understand how the key points of your data are found and the effect that the floor surface (and other things) can have on the quality and utility of your data.
-
If you do test on multiple surfaces, know what the difference between surfaces will be and compare data accordingly.
-
Take responsibility for your data, own it!
Applied Note:
One of the ways you can jump on multiple surfaces and keep track of which surface you are jumping on is by using the "Tag" feature that is built into our Hawkin Dynamics software. Here, you can watch a short video on how to use this feature. An example tag you could use for this is "Weight Room," "Basketball Court," etc. You can also create a tag for the time of day. For example, "AM Jump" vs. "PM Jump".
Testing Protocol
Here's the testing protocol that Drake used to collect the data shown in Table 1...
- Moved the plates to the destination
- Setup the plates, standing on them until they were flush to the surface with no wiggle
- Turned on the plates, connected them to the tablet
- Zeroed them in and tested the zero by using ‘Free Run’ mode for a period of 15 seconds
- Once zero was established, the testing began
- Three attempts were conducted on each surface, and the best jump height of the 3 was used
- Repeated at the next location.
Testing was completed back to back day, at the same time each day. No exercise was performed between days, and the diet remained consistent each day.
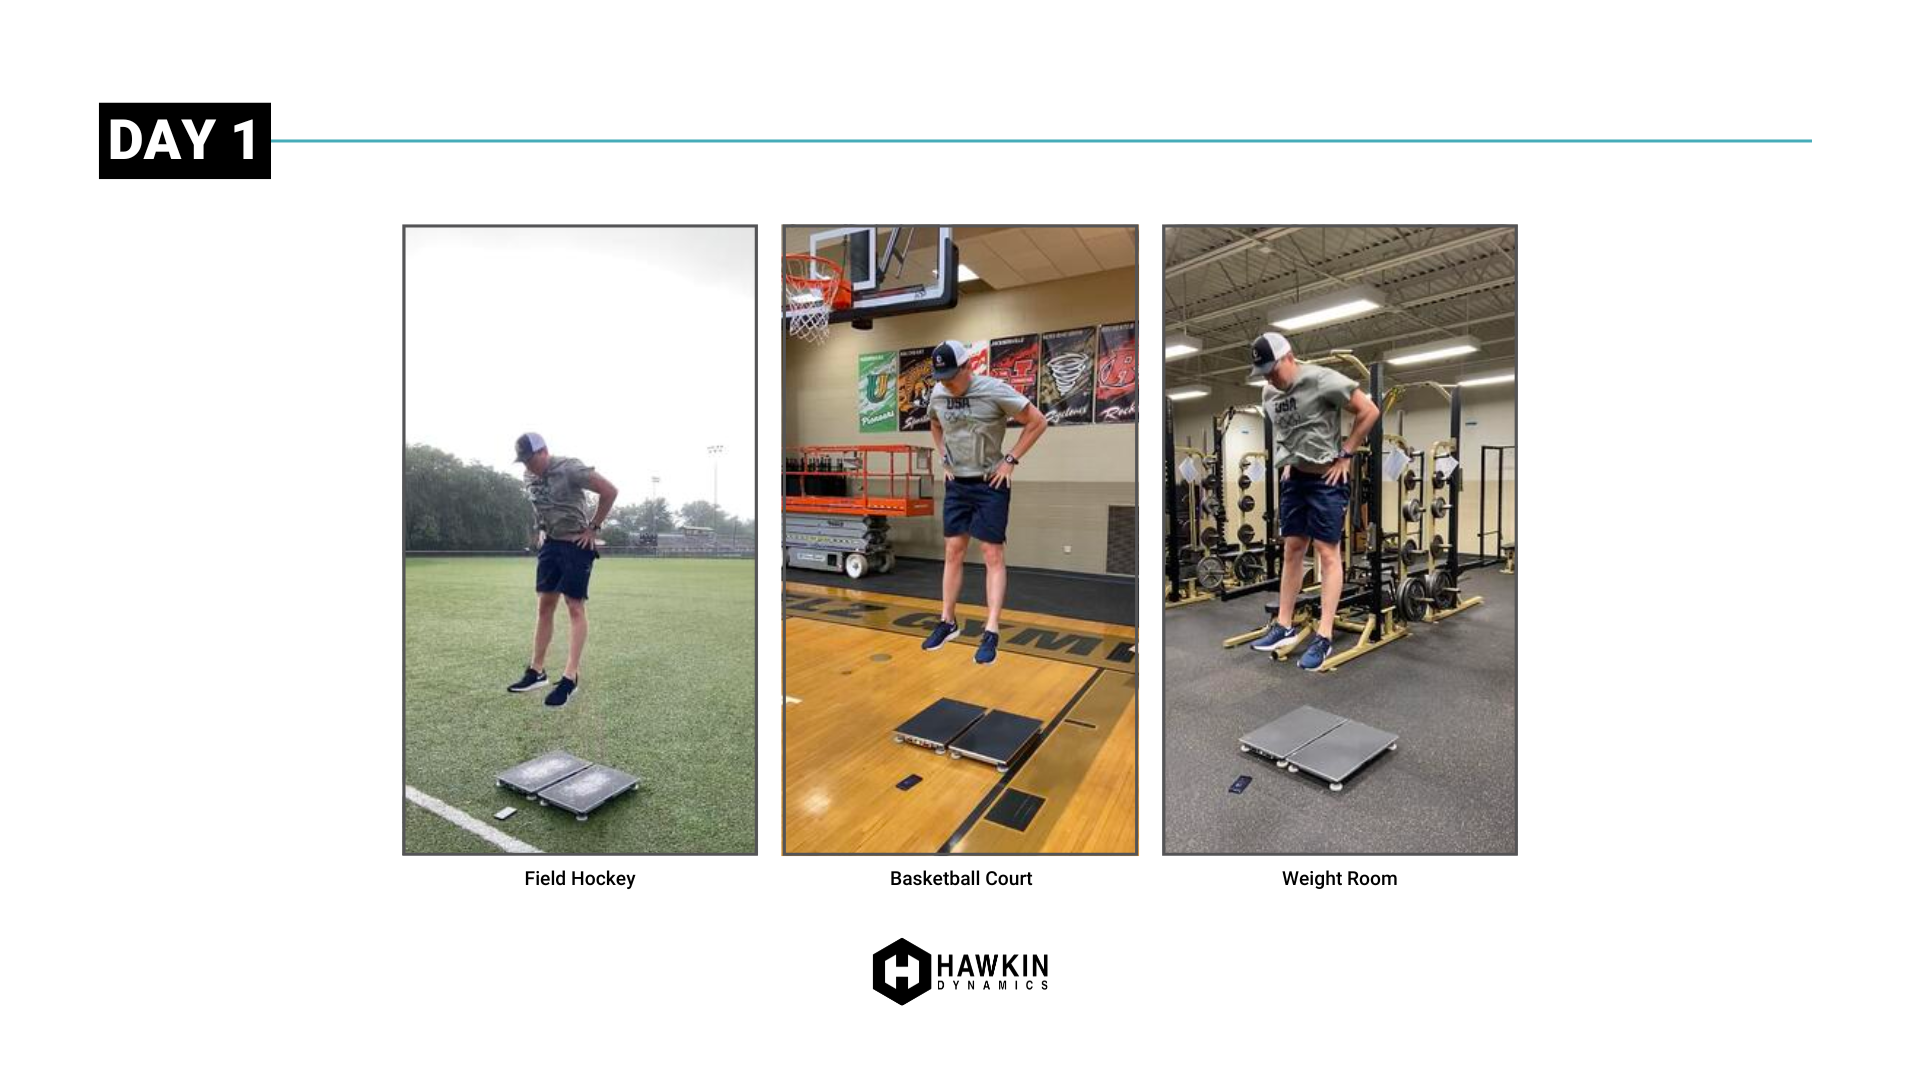
Day 1: Field Turf, Basketball Court, Weight Room
-png.png)
Day 2: Track, AstroTurf, Baseball Dirt, Foam Tiles, Grass, Tennis Court, Concrete
Editor's Note: This post was originally published in July 2020 and has been revamped and updated for accuracy and comprehensiveness.