-2.png?width=156&height=60&name=Hawkin%20Logo%20(2)-2.png)

Introduction
Well, this sounds serious? Please don’t panic though. Instead, think of this article as a reminder to review your current practice to ensure that you maximize the quality of your force plate data.

Okay, so ‘how?’ you might be asking. Well, hopefully you’ll remember how I regaled with the tale of how we convert our jumping force data to velocity data using integration. If you’ve tuned in to any of our webinars you’ll also know how important we think the ‘start’ part of your data collection is. These are the two elements I’ll be focusing on today so strap yourselves in!
(1) The ‘start’
So, you’ll often hear people talk about how important things like the ‘basics’ and ‘strong foundations’ are.
It just so happens that they are critical to maximizing the quality of your force plate data too.
For example, we believe fiercely that the ‘start’ is the ‘foundation’ of any force plate testing. This might sound a bit cryptic, so what do I mean by this? Well, quite simply, if the test ‘start’ is poor then your data will be poor too – especially if you’re planning on deriving any data that are based on velocity. To illustrate this, let’s use the countermovement jump (CMJ) as an example (but we can apply the following principles to pretty much all force plate tests)…
When our software processes your CMJ data it relies on the assumption that the athlete’s initial velocity is zero.
This is so important that it really does bear repeating: our force plate data processing relies on the assumption that the athlete’s initial velocity is zero.
That’s right. They’re standing still. Not moving. Not picking their nose, scratching their butt, or doing a little jig while they look you in the eye and swear on their mother’s life that they’re standing still (yes, these are all things we’ve noticed over the years of the force plate testing we’ve done between us here at Hawkin Dynamics). All jokes aside, one thing we often see is "jump mat starts", especially from athletes who are accustomed to altering their start on a jump mat to "cheat" the test. Visually, this is when the athletes rise up on their toes prior to the start of the test...this is not the best practice on force plates and will not help you achieve a higher jump. It will only affect the quality of the data you collect.
This is so incredibly important because the less still your athlete is, the ‘noisier’ your force data (how smooth the signal is) will be. And, the ‘noisier’ it is the less accurate any velocity and velocity-derived metrics (like displacement and power) will be further down the processing line.
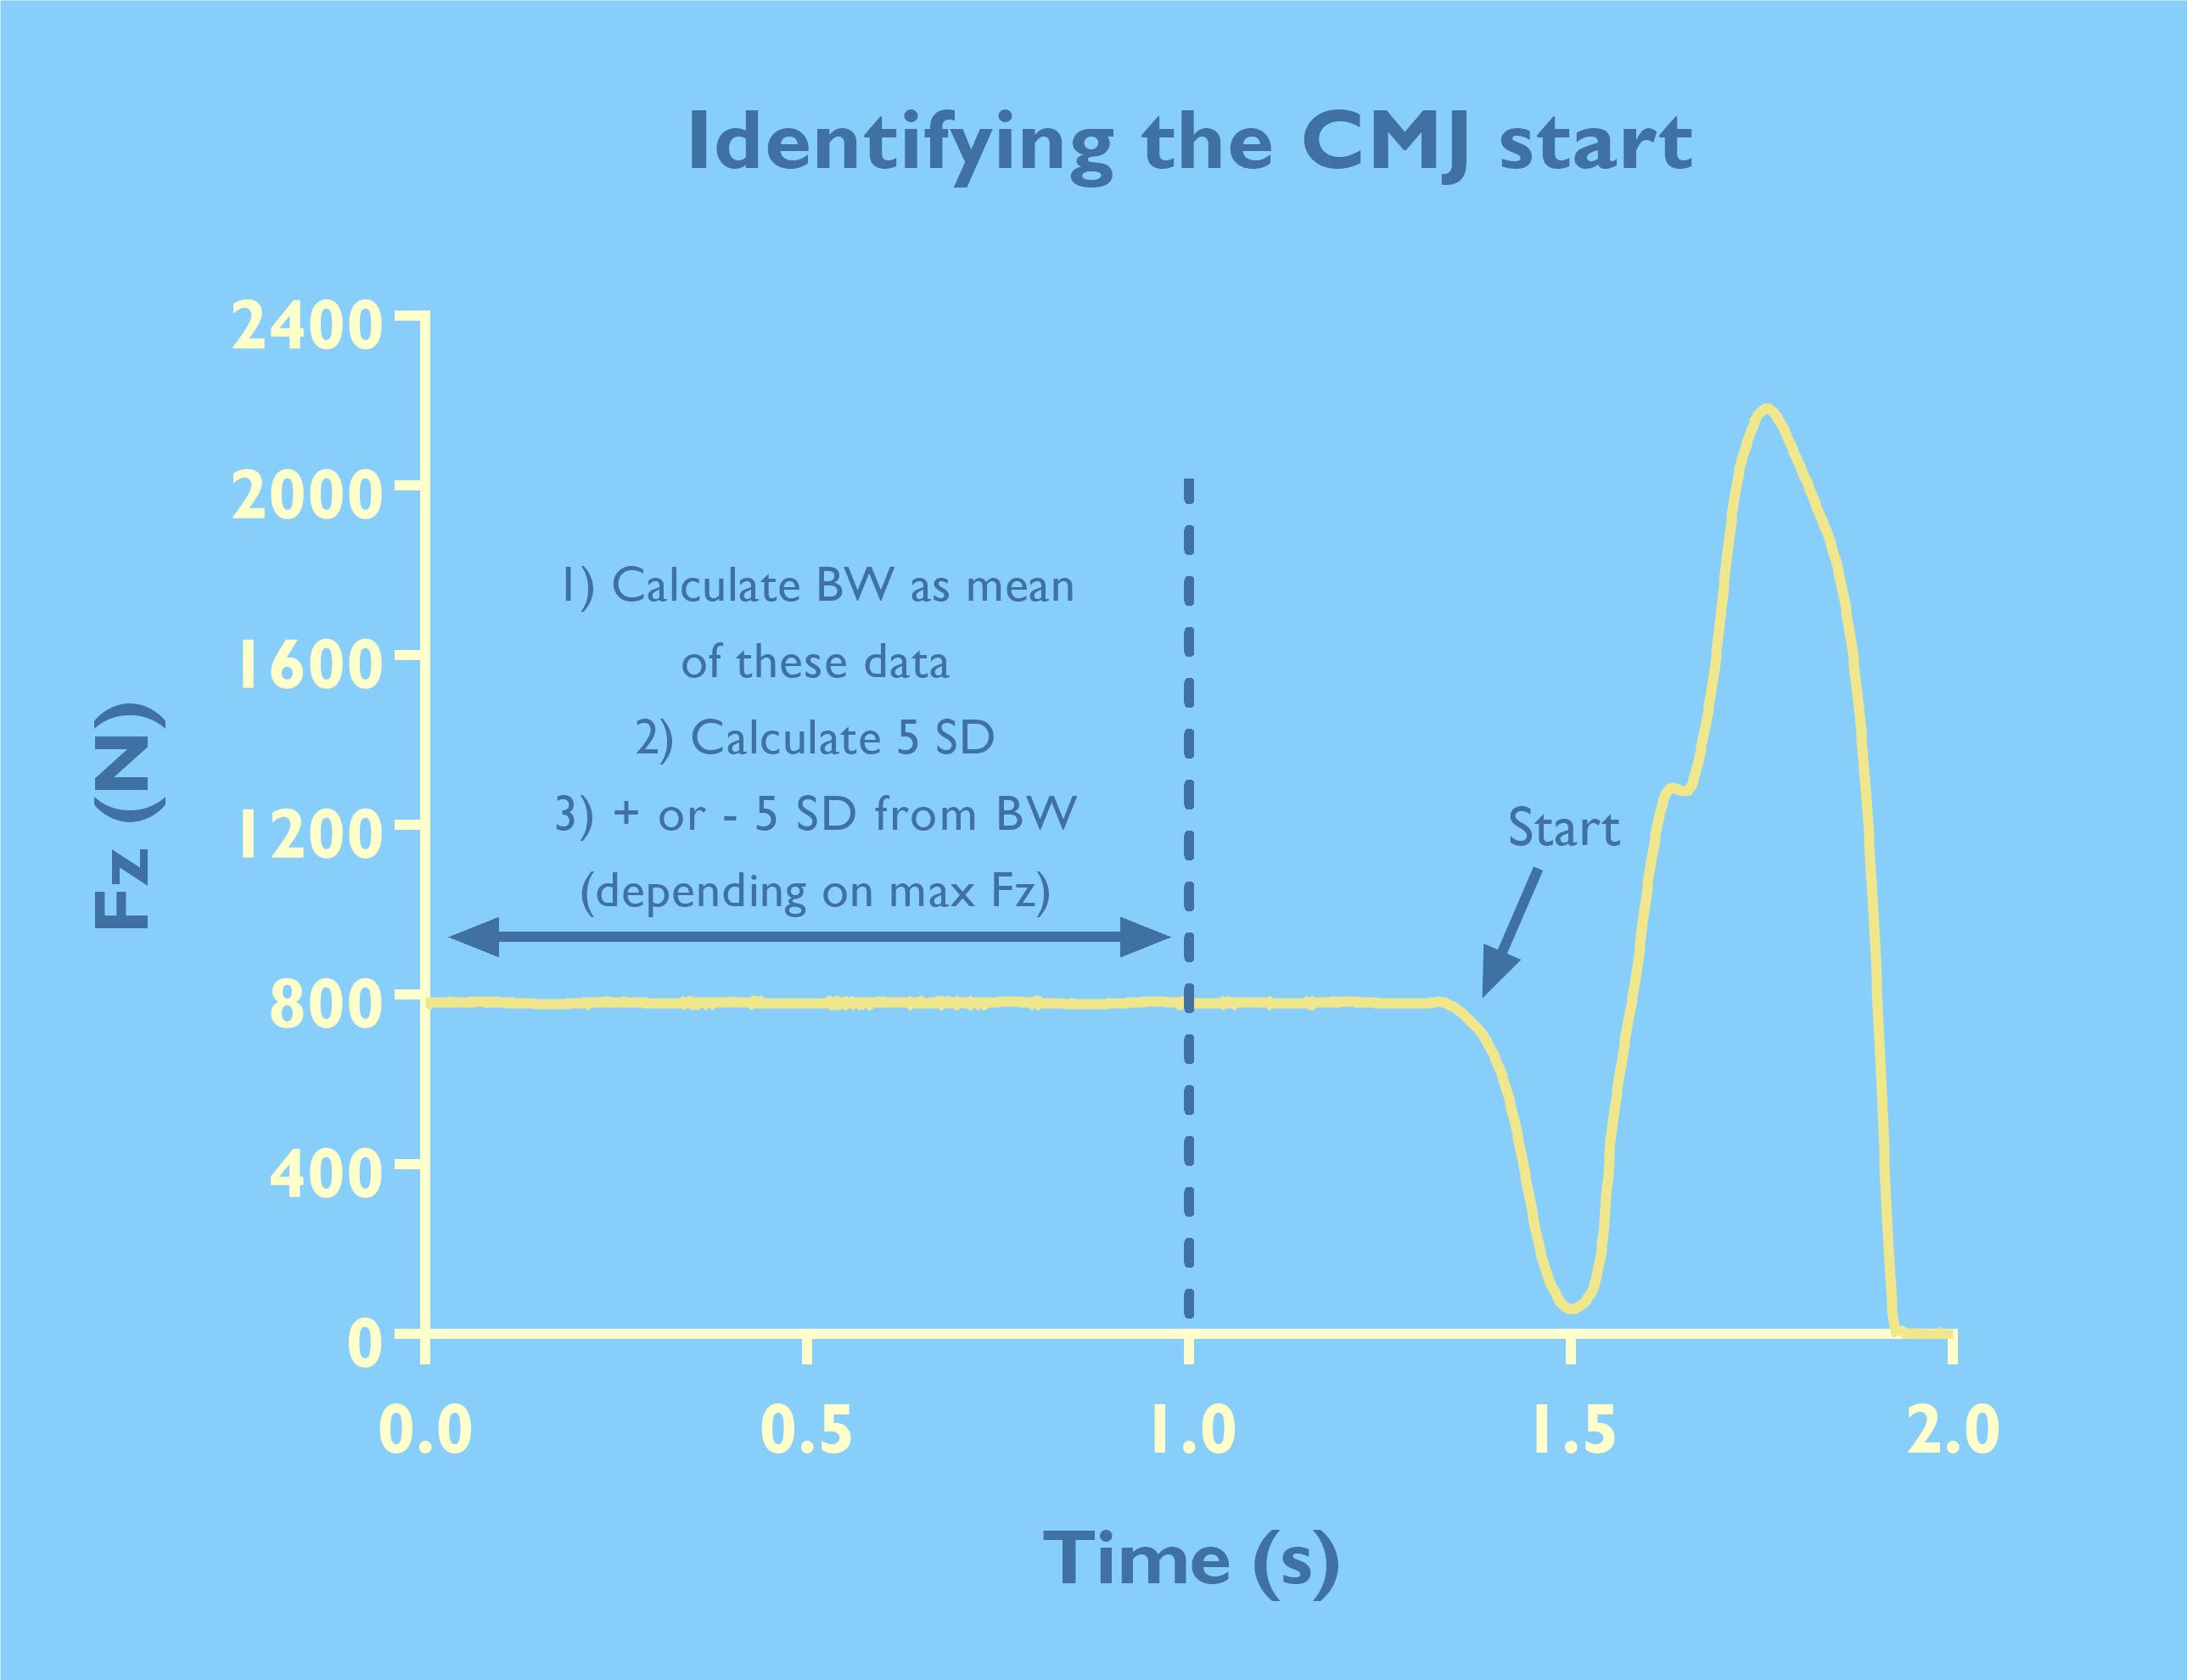
Figure 1. How we identify the start of a CMJ.
A quick reminder, ensure that your athletes stand still for at least 1 s. Because we know how tricky this can be our software won’t let data be collected unless it achieves a certain ‘stillness’. Figures 1 and 2 provide some insight into what we do with these data to calculate athlete weight and the start point. Not all other systems have this. That isn’t a knock on other systems, more a reminder that whatever force measurement system you use, remember that you are in charge of taking ownership of the data collection process and understand that this will influence data quality.
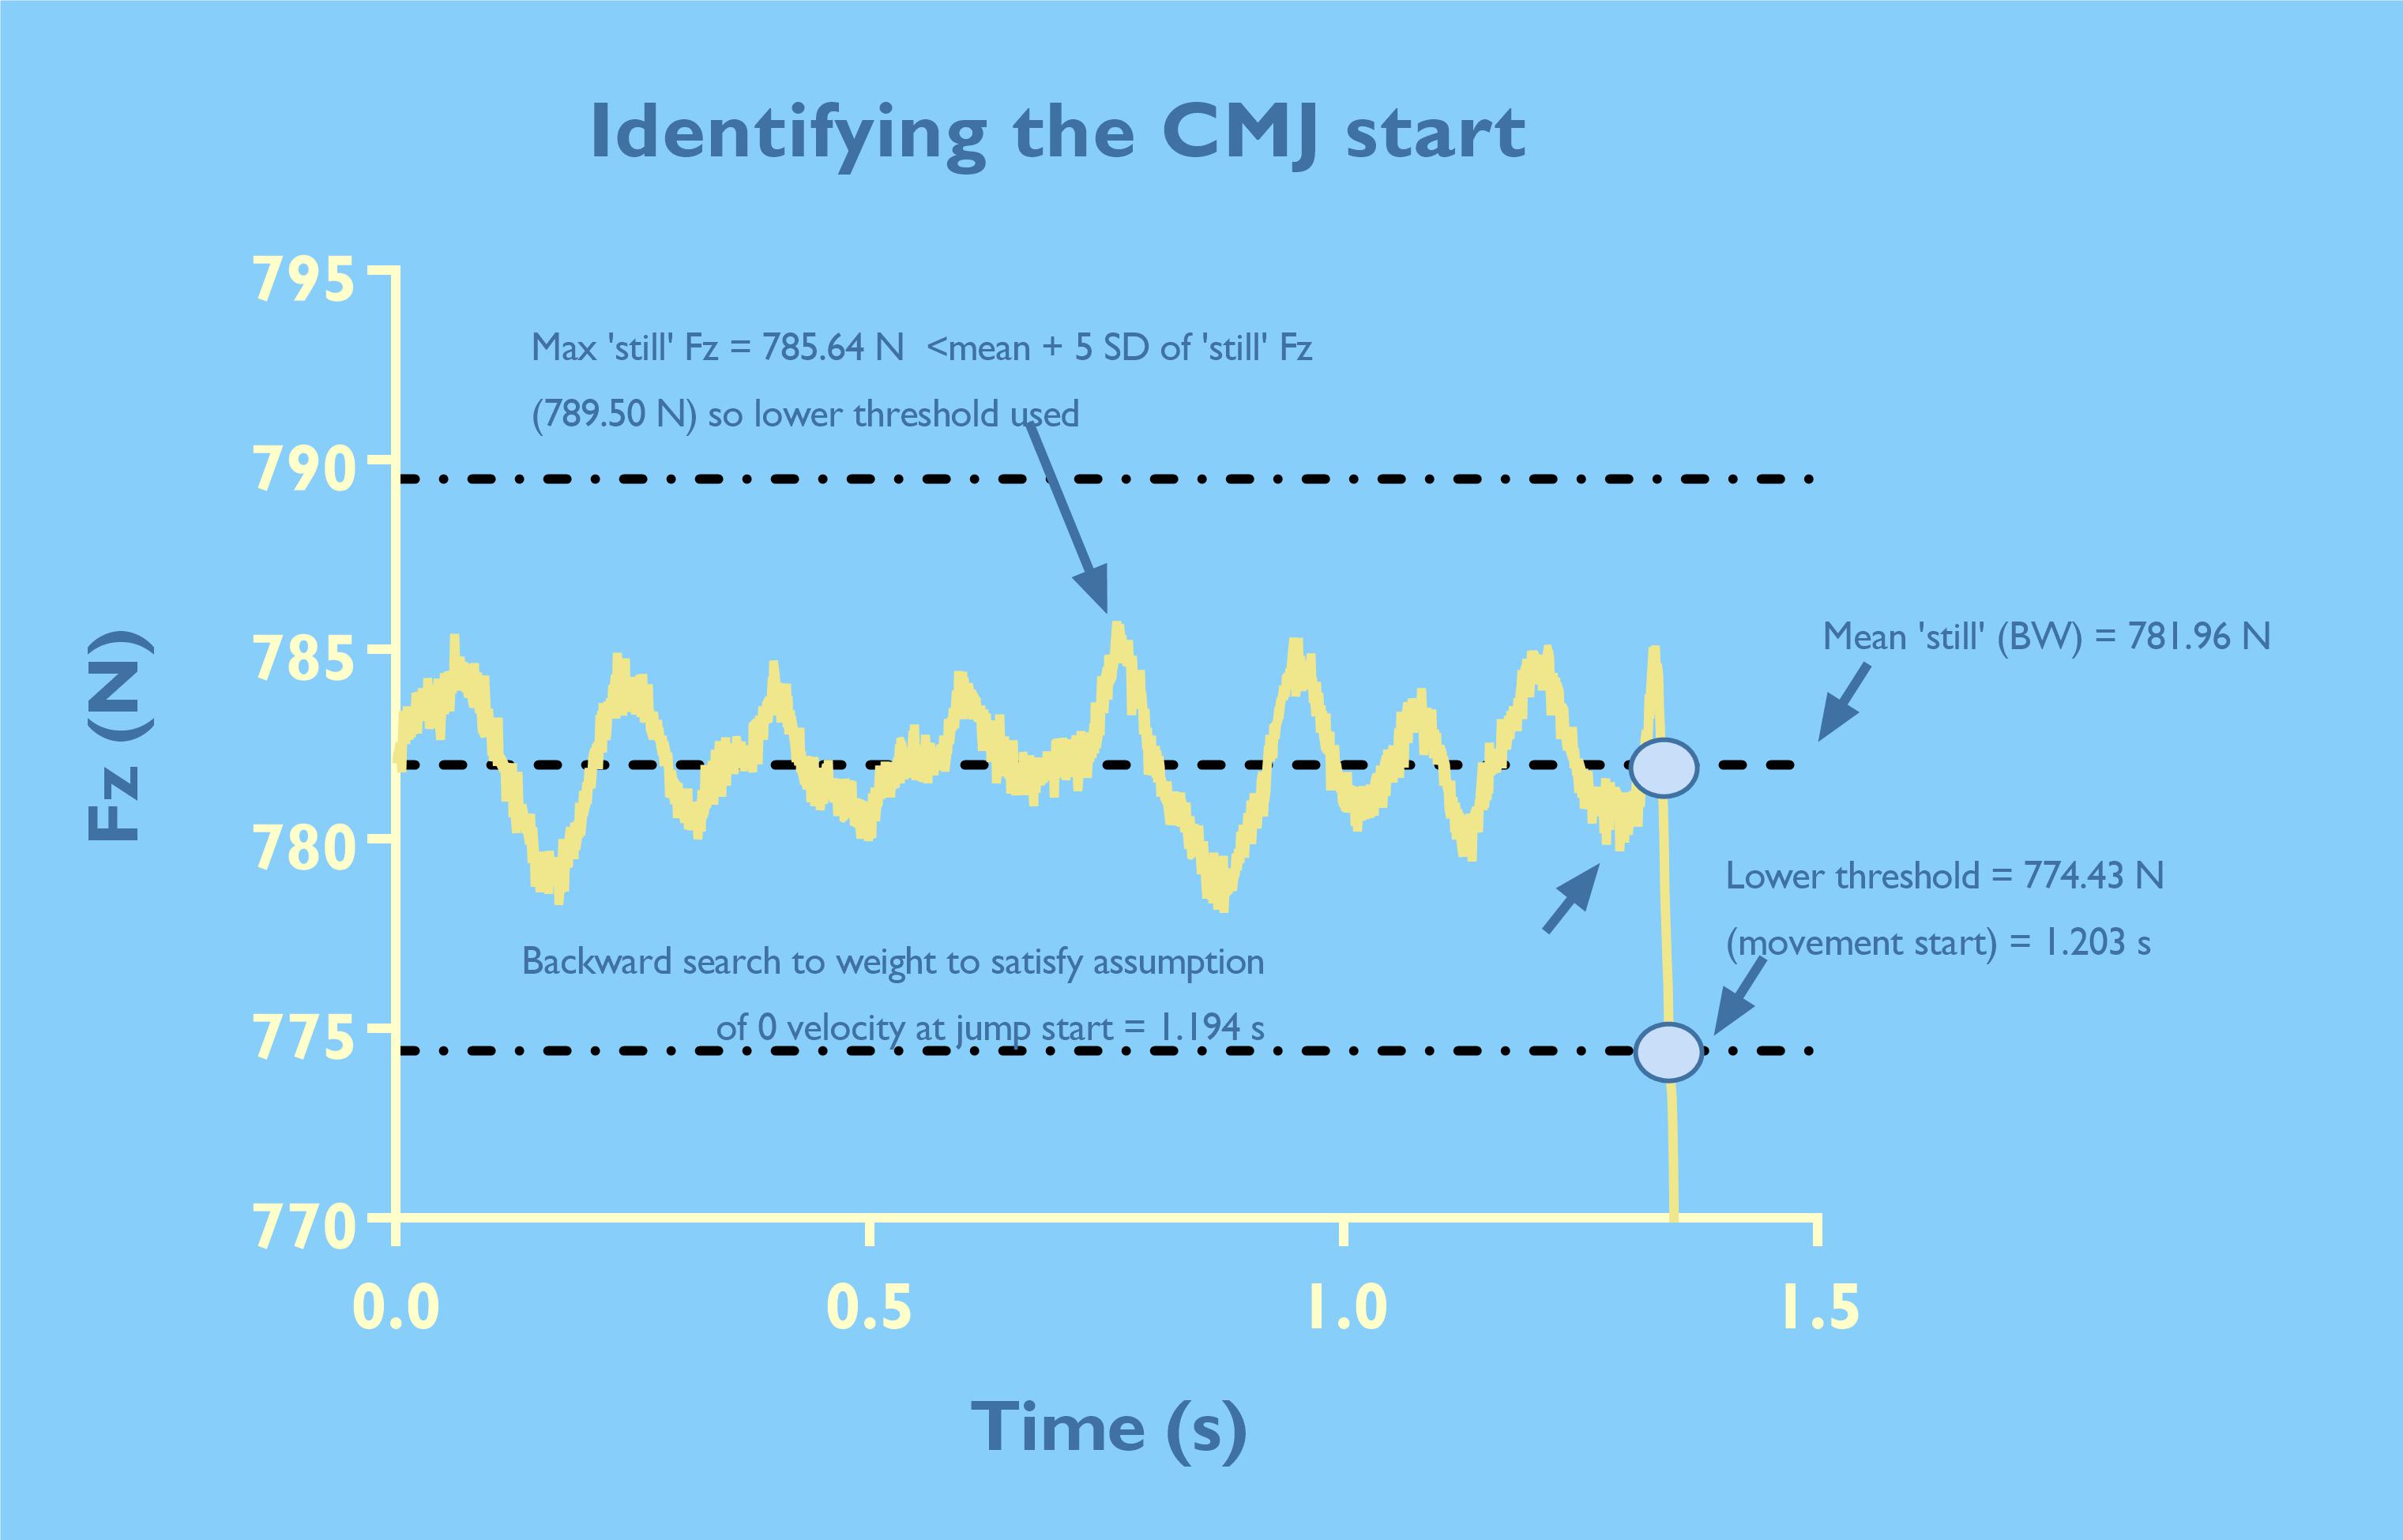
Figure 2. The 'nitty-gritty' of identifying the CMJ start.
So, when I guided you through how we integrate force plate data to calculate velocity and velocity-based metrics I explained that essentially we multiply each sample of our acceleration data (remember that this is calculated by dividing net force data (force less athlete [and any additional load]) by the athlete’s mass) by the sample duration before we successively sum it on a sample-by-sample basis. Because Hawkin Dynamics plates record at 1000 samples per second (i.e. 1000Hz), this means that we multiply the acceleration recorded every 0.001 s by 0.001 s.
This is where I urge caution about letting your athlete stand still for too long pre-jump, because this can influence your data too (see Figure 3). To illustrate this, Table 1 shows key metrics obtained from the same trial, ‘all data’ included the athlete standing still for over 4 s, while for the ‘1.2 s data’ trial data were cropped so that we only considered approximately 1.2 s before an obvious change in force. Now, you might be thinking, ‘so what?’. Well, read... I’m a firm believer that countermovement depth should be considered a key part of an athlete’s jump strategy. Therefore, while there are small differences in most metrics (they may still be meaningful), the 13% difference in countermovement depth has the potential to completely change the way you interpret the data from this trial. Note how ‘still’ the athlete is standing in Figure 1 and 2 – aim for this where possible.
Hawkin Sport Science Note: The best practice is to have the athlete jump immediately after the beep and flash to eliminate possible human error by the athlete.
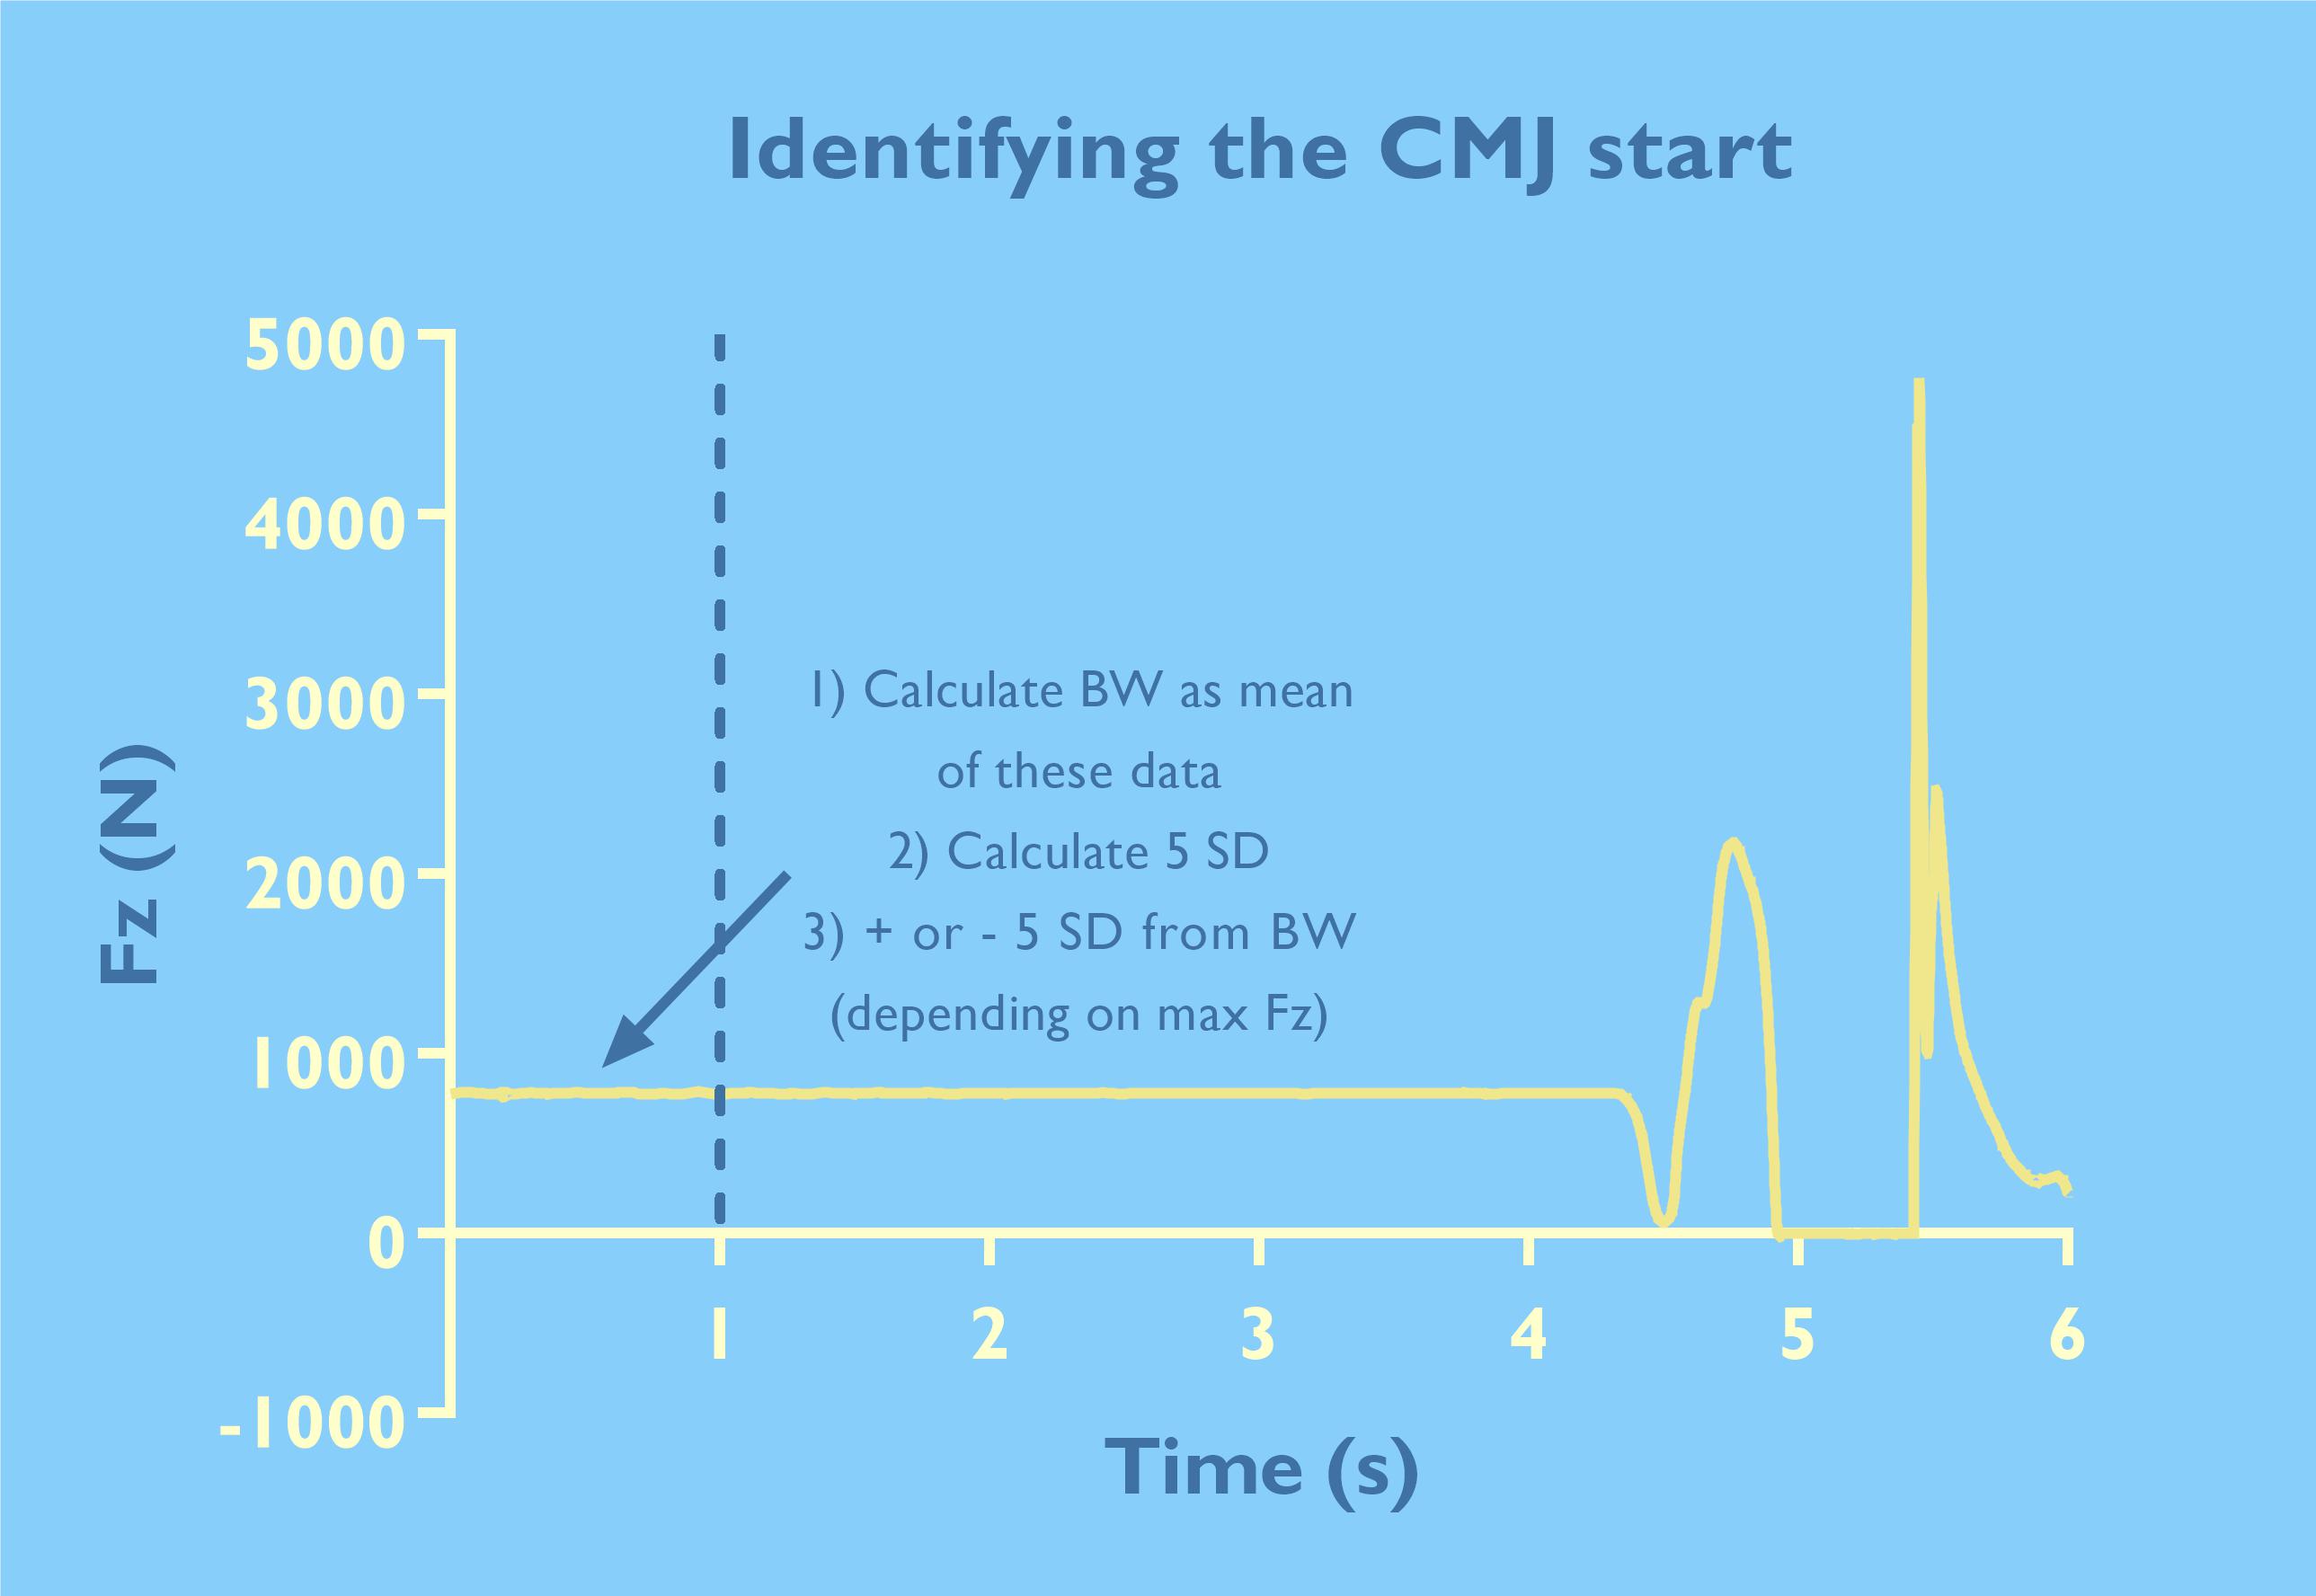
Figure 3. How long should you athlete stand still for?
The Outcome of Standing Too Long During Quiet Weighing Period
Table 1. The effect that pre-jump standing still duration has on key metrics.
|
Metrics |
all standing still' data (+4s) |
1.2 s standing still' data |
% difference |
|
Countermovement depth (m) |
-0.177 |
-0.203 |
13% |
|
Braking peak force (N) |
2055 |
2055 |
0% |
|
Braking mean force (N) |
1374 |
1374 |
0% |
|
Braking peak velocity (m/s) |
-1.081 |
-1.091 |
1% |
|
Braking mean velocity (m/s) |
-0.700 |
-0.710 |
1% |
|
Braking peak power (W) |
-1192 |
-1204 |
1% |
|
Braking mean power (W) |
-866 |
-880 |
2% |
|
Braking time (s) |
0.144 |
0.144 |
0% |
|
Propulsion peak force (N) |
2183 |
2183 |
0% |
|
Propulsion mean force (N) |
1692 |
1692 |
0% |
|
Propulsion peak velocity (m/s) |
2.435 |
2.424 |
0% |
|
Propulsion mean velocity (m/s) |
1.520 |
1.510 |
-1% |
|
Propulsion peak power (W) |
3671 |
3653 |
0% |
|
Propulsion mean power (W) |
2233 |
2215 |
-1% |
|
Propulsion displacement (m) |
0.309 |
0.306 |
-1% |
|
Propulsion time (s) |
0.202 |
0.202 |
0% |
|
Jump height (m) |
0.269 |
0.267 |
-1% |
(2) Integration ‘drift’
We also need to be aware that if you perform more than one jump (or other ground-based movement, like the squat) the longer the trial lasts and the less accurate the integration of our acceleration data will be. This is ‘integration drift’ and it has the potential to really mess with your data.
Take a look at Figure 4. You’ll see that actually the athlete didn’t do that great a job of standing still. However, the way we process force data means that we consider this ‘noise’. We average 1 s of standing still force and in this case, this shows that the athlete’s weight was just over 865 newtons (about 88 kg or 194 lb). We then follow the steps shown in Figures 2 and 3.
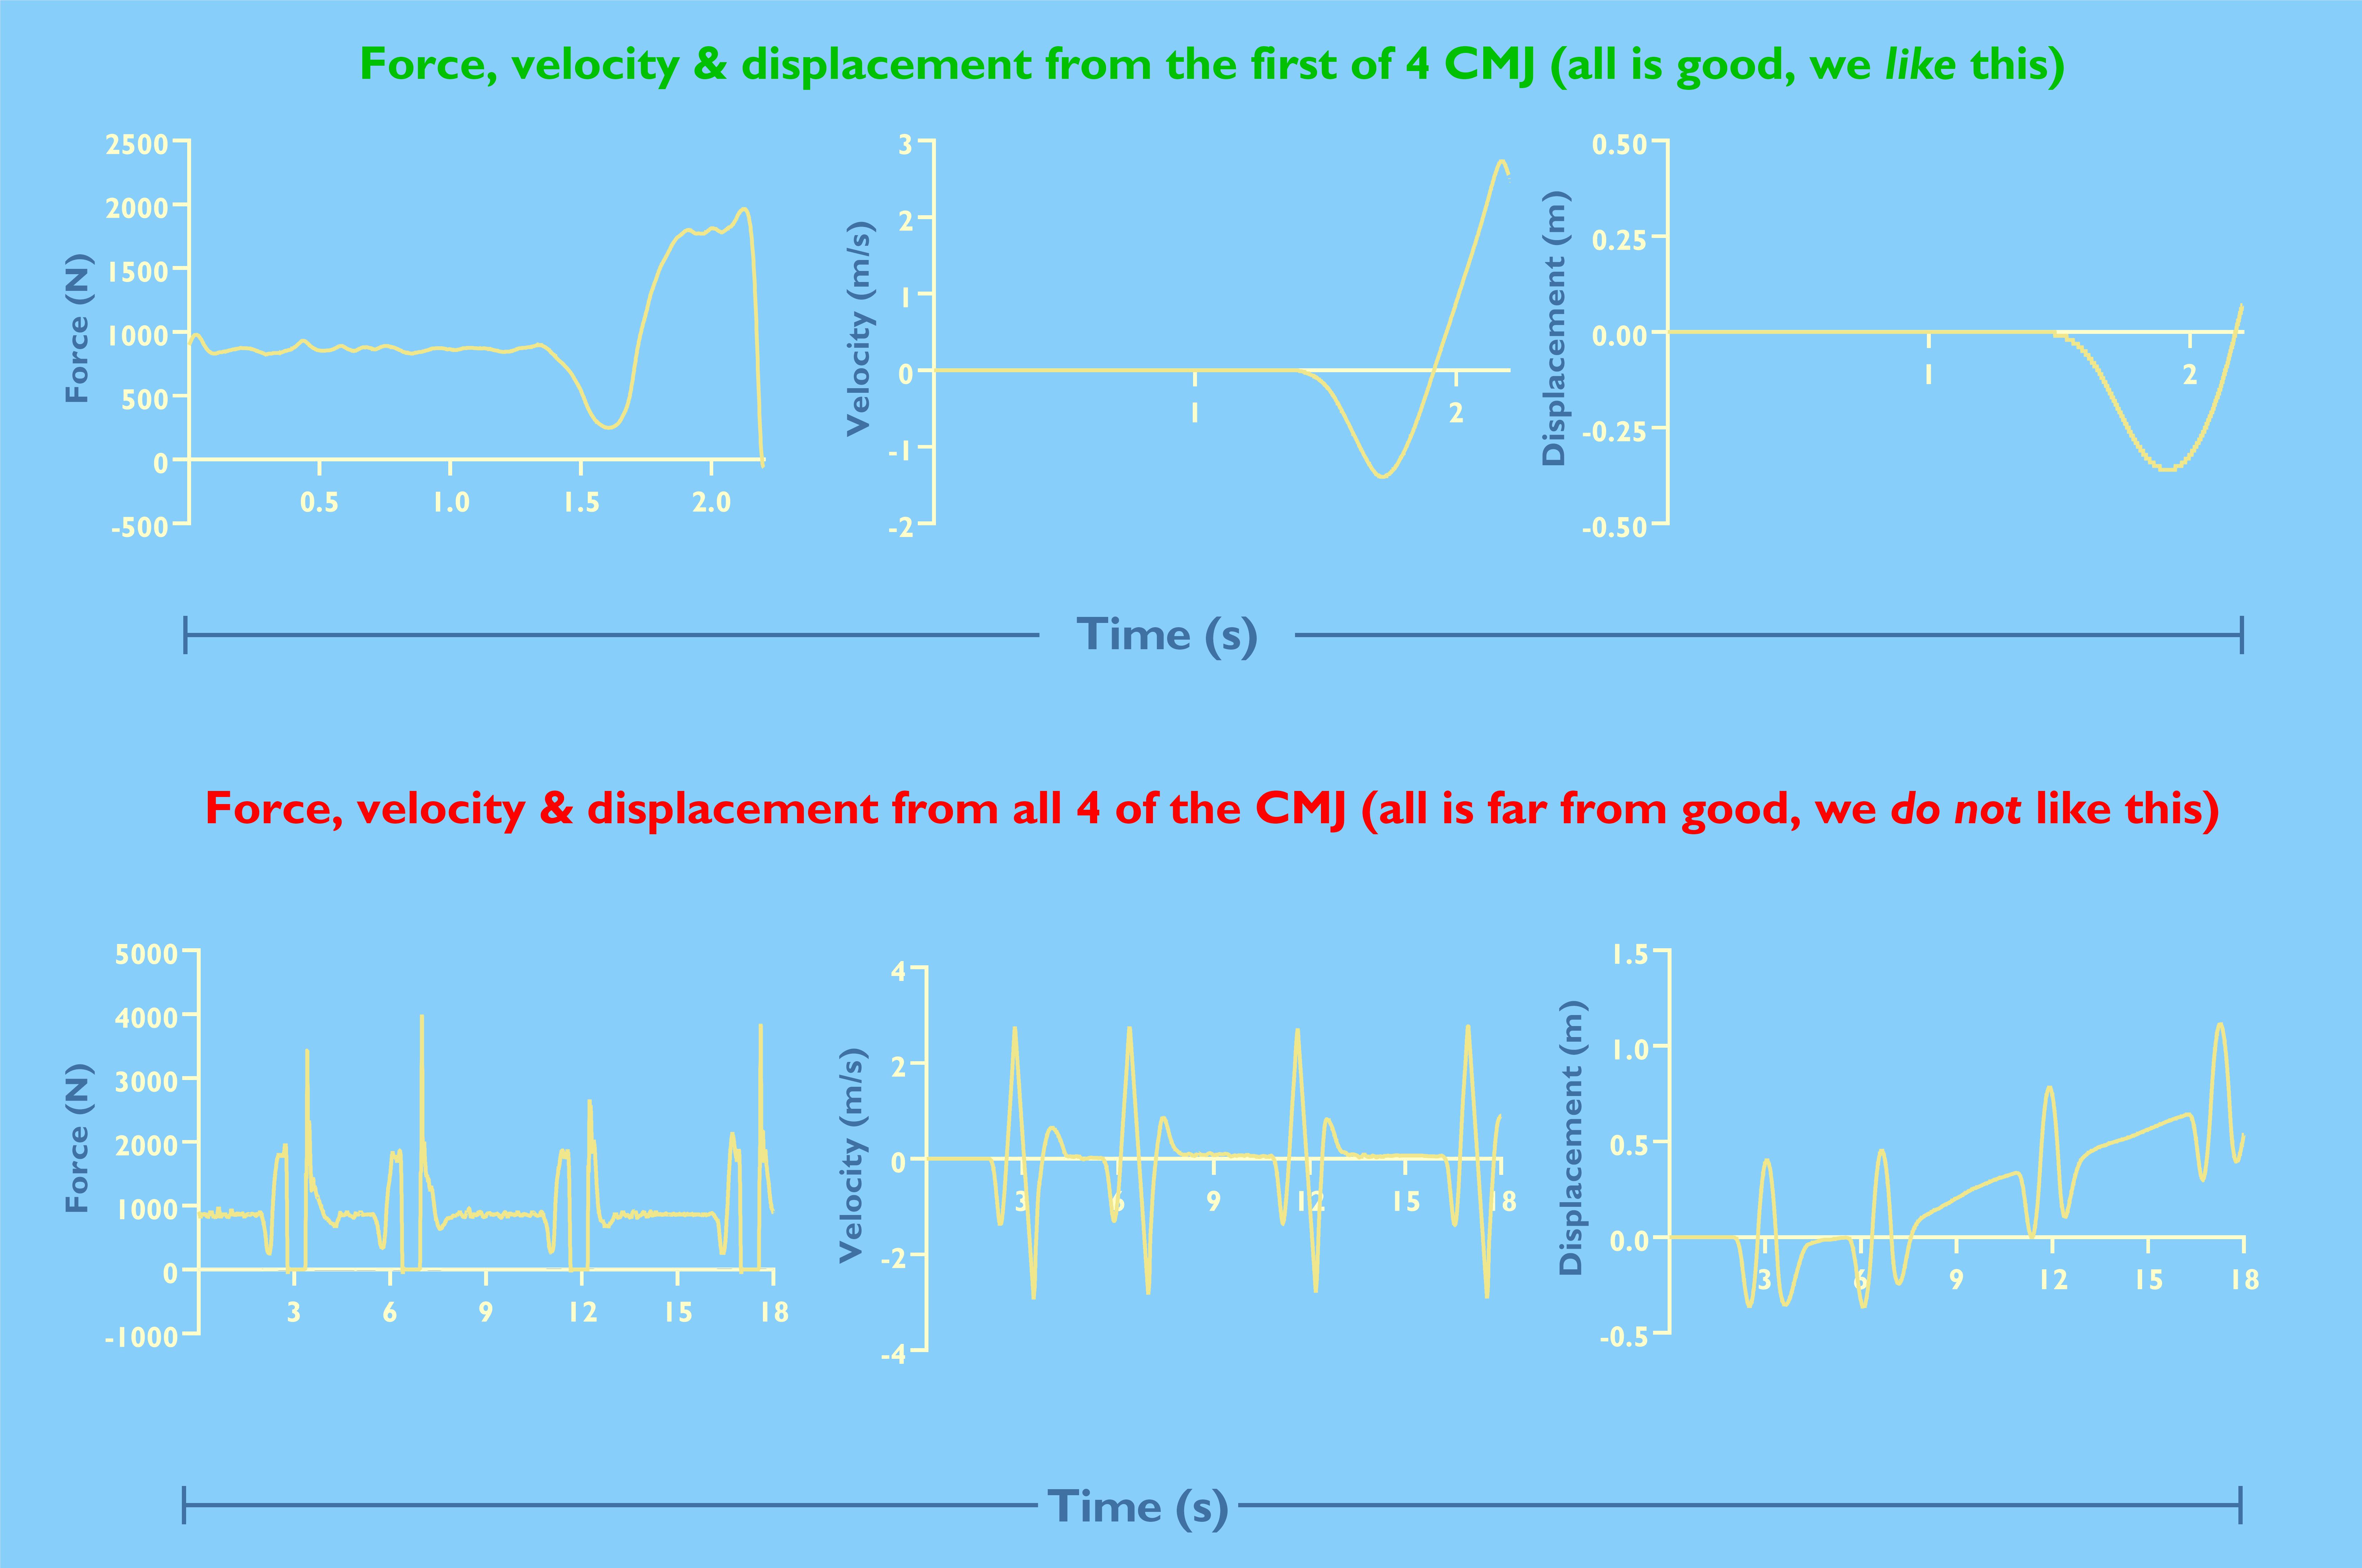
Figure 4. Processing the first and all four trials from a set of repeat CMJ.
Hawkin Sport Science Note: The area of interest in the figure above is displacement, specifically the image in the bottom right-hand corner. See how the curve "drifts" up and to the right. This is integration drift, and will most likely alter your jump metrics if you perform more than one jump without saving the trial, or reset completely between trials.
This finds the first ‘real’ change in force, leaving little chance that this change won’t be ‘real’. This is the start of the athlete’s movement. Because they need to be still for the data integration process, we then search backward to find the last force that is equal to their weight. At this point, they are still and so integration to calculate velocity from an initial zero velocity begins (see Figure 2).
If we process the data from the first CMJ shown in Figure 4 (top) we get the velocity-time and displacement-time curve shown next in Figure 4. However, look at what happens if we include all four CMJ from this same trial - Figure 4 (bottom). Our velocity-time and displacement-time data start to ‘drift’; velocity slightly, displacement much more. Like seriously more. Of course, this will influence the accuracy of any other velocity or displacement-derived metrics, like power and stiffness for example. However, how many force plate users are aware of this? We think it’s a big deal (hence this article).
Thankfully we’re aware of this and so if the user follows a robust protocol, we can remove this drift (there are several methods out there on the interwebs, ‘detrending’ data perhaps been the simplest). However, because of the dramatic effect, the multiple CMJs have on our data, it is even more important that the athletes begin the jump by standing as still as possible (I know, I know, I sound like a broken record, but it is so important). Additionally, it can really help us if you stand still for around 1 s at the end of the jumps (or other movements) too.
Hawkin Sport Science Note: Ensure you have the best setup possible prior to collecting data for the day. Watch this 1-min video here on how to set up your plates and check the zero.
The wrap-up
Remember, we should all take responsibility for the quality of our data. And we can only do that if we’re aware of the factors that affect it. As our bumbling Prime Minister (here in the UK) suggests, ‘stay alert’. I’m not entirely sure how this will stop the spread of a novel virus, but it really can help us maximize the quality and accuracy of our force plate data so that we can gain meaningful insights about our athletes.