-2.png?width=156&height=60&name=Hawkin%20Logo%20(2)-2.png)

Upper Body Isometric Strength Testing (Part 2)
Guest Post By: Aaron Trunt, MS – Lead Biomechanical Engineer, Sanford Sports Science Institute
Read the original research article by Aaron Trunt here.
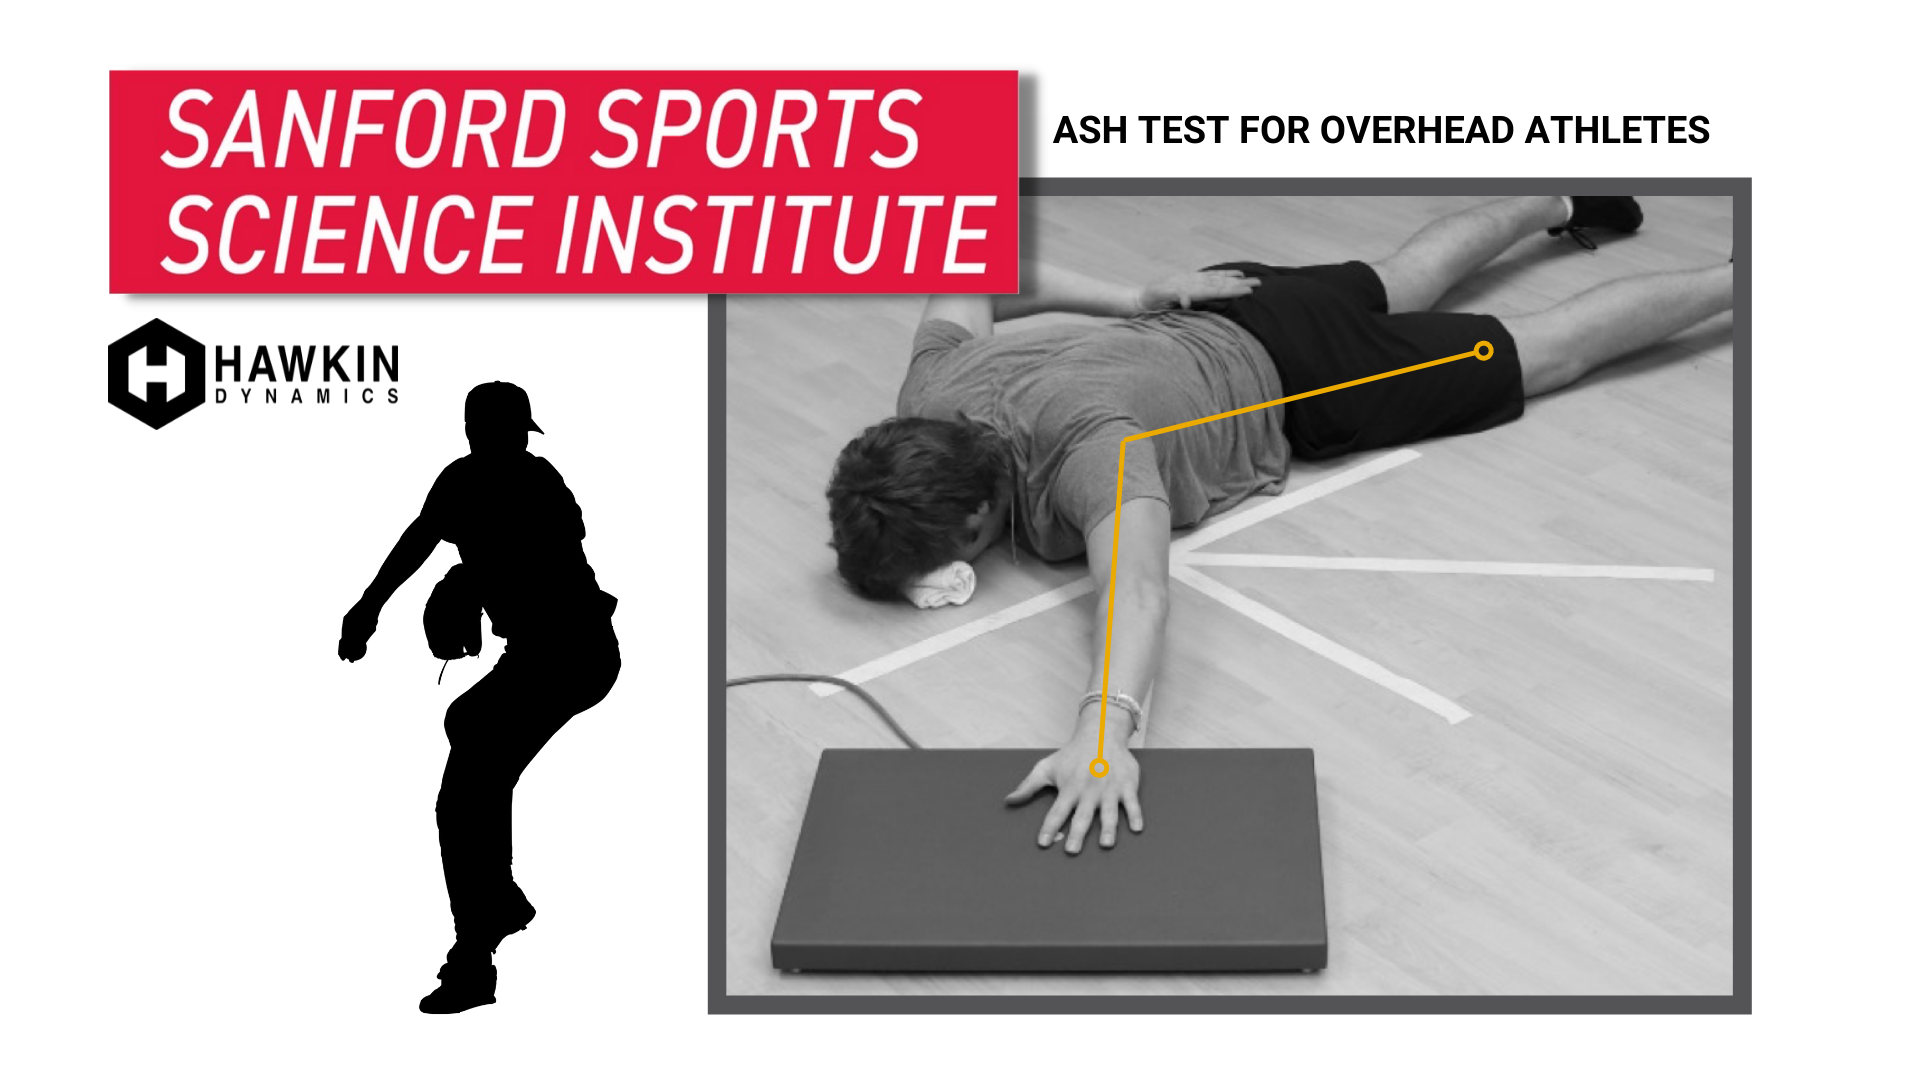
Figure 1: Sanford Sports Science Institute has conducted over 1,500 individual ASH Tests since 2019. In 2021, they presented at the American Society of Biomechanics here.
Introduction
In the last blog (Part 1) about the ASH test, we discussed the utility, history, and protocol for using the test as part of regular monitoring for upper extremity strength and function. It is essential to understand these things before implementing them into your sports science toolbox. Now that we’ve been armed with this knowledge, let’s discuss a specific use-case example of administering the ASH test in an athletic population and reflecting on the results.
I will preface this by reminding the reader that the ASH test is still very new in the world of athlete testing with only 4 studies (to my knowledge) that have published data using the ASH test. I therefore urge you to explore the test yourself and collect your own data on the population you work with to gain a deeper understanding of what the test looks like in your athletes.
We at the Sanford Sports Science Institute (SSSI) have been exploring the ASH test in overhead athletes since 2019. Mainly, we use the test as a preseason screen of shoulder health in baseball players and as part of a battery of tests for injured athletes rehabbing upper extremity injuries. Since 2019, we have completed over 1,500 individual tests and have found interesting results both in healthy athletes as well as those with a history of UE injury, some of which I will share with you below.
Some Context
We use the ASH to test 4 different shoulder positions (I,T,Y,I) with 3 reps at each position for both the dominant and non-dominant arm. I personally like using the ASH test for athletes recovering from shoulder injury because of the isometric nature of the test. The test setup allows the athlete to have good stability through the shoulder joint and we are not moving them through any active range of motion that would stress the injury location. The test also has direct transfer to overhead athletes whose sport requires their arm(s) to be in one of the various positions covered as part of the protocol making it a favorable test to use for healthy athlete monitoring (see ASH Part 1 for more background).
If you’re familiar with overhead athletes, like baseball pitchers, then you know that their shoulder undergoes a specific set of adaptations to allow them to throw a baseball harder. These adaptations include changes in shoulder range of motion and rotator cuff strength. While these adaptations are considered normal, and even healthy, it has been shown through research that monitoring these qualities in pitchers is important for injury risk stratification. Range of motion is quite easy to monitor objectively, but isolated shoulder strength can be difficult (and expensive) to quantify reliably and accurately. Enter the ASH test.
"I personally like using the ASH test for athletes recovering from shoulder injury because of the isometric nature of the test." -Aaron Trunt
Results
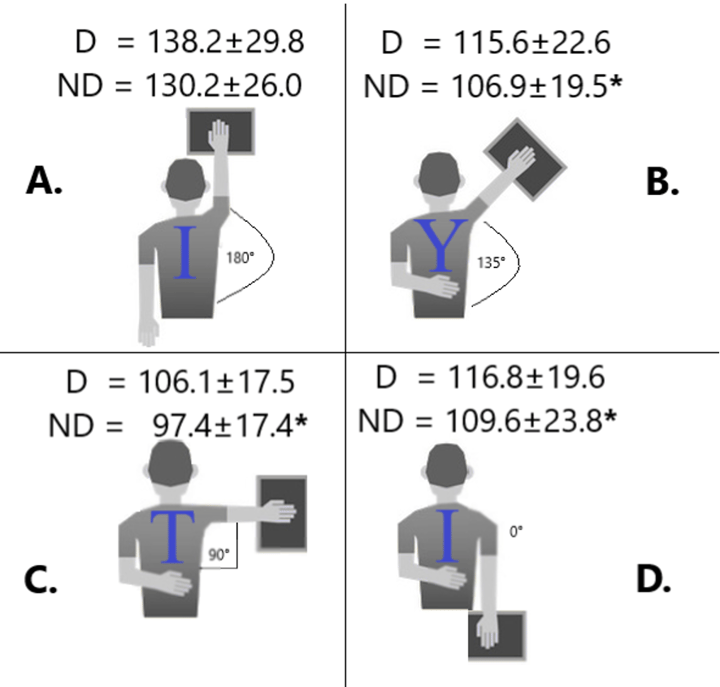
Figure 2: Results from the ASH Test. Values presented are Peak Force in Newtons. D=Dominant Arm; ND=Non-Dominant Arm. *statistically significant difference between arms
Above I provide results from a group of NCAA DII college baseball pitchers (n=33) before their anticipated season. You’ll notice I present the data in both absolute (N) and again below in relative (%BW) values, remember it’s best practice to use relative values when comparing results between athletes, but absolute is okay for tracking the same athlete over time. Another thing you might notice is that unlike other studies using the ASH test in non-throwing athletes, these baseball pitchers have significantly greater peak force production in the throwing arm compared to the non-throwing side (in all but 1 of the test positions). We should’ve seen that coming though, given what we know about overhead athletes. Even more interesting, is that the greatest bilateral differences are at the “T” and “Y” positions, or the two positions most closely mimicking the angle of the arm during throwing. Now we can start to see how the test has a specific transfer to sport. Based on these results, it would be reasonable to assume that other overhead athletes, like volleyball players or swimmers, would show the greatest bilateral differences in the “I” position (A. in the figure above).
If you’re strapped for time and can only test one of the above positions, I recommend testing the position with the most obvious transfer to the sport your athlete plays. Having this healthy baseline before the season starts allows us to look at arm health throughout the season, before or after competition, or if the athlete is injured and needs rehab.
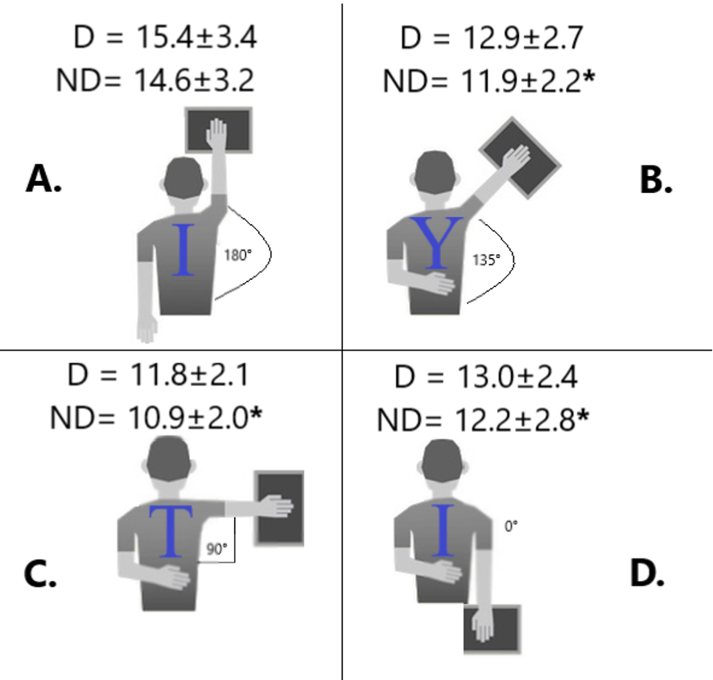
Figure 2: Results from the ASH Test. Values presented are Peak Force in % of body weight. D=Dominant Arm; ND=Non-Dominant Arm. *statistically significant difference between arms
When we look at the results in % body weight (BW) you’ll see that, on average, these pitchers all produce peak force >10% BW in each position—even on the non-dominant side. Digging a little deeper into the data, it is pretty rare for a pitcher to have a peak force <10% with their throwing arm (0 pitchers in A, 3 in B, 5 in C, and 2 in D). This gives us a pretty good threshold for determining if a pitcher’s arm is healthy: if a pitcher can’t produce 10% bodyweight of peak force in the “T” or “Y” position, there might be some underlying issues or potential fatigue from throwing, training, etc. Of course, if you test your pitchers regularly, you have a good idea of what their “normal” value is for the ASH test, but this data can provide a starting point. Lastly, there is only 1 instance in this group where a pitcher failed to get to 8% BW of peak force with the throwing arm, so 8% could be a good “floor” value for quantifying arm health.
"This gives us a pretty good threshold for determining if a pitcher’s arm is healthy: if a pitcher can’t produce 10% bodyweight of peak force in the “T” or “Y” position, there might be some underlying issues or potential fatigue from throwing, training, etc." - Aaron Trunt
Bilateral Strength Ratios from the ASH Test
|
Test Position |
"I", 0 degrees |
"T", 90 degrees |
"Y", 135 degrees |
"I", 180 degrees |
|
Ratio (D/ND) |
1.08 |
1.10 |
1.09 |
1.07 |
Table 1: D/ND = ratio of Dominant to Non-Dominant arm
When we look at the bilateral ratios though, we see almost identical results at every test position: the throwing arm is between 7-10% stronger than the non-throwing arm. This is where we need to hit the brakes with regards to arm health. Consider this example: you’re a clinician working with a college pitcher rehabbing a shoulder injury. You tested this athlete with the ASH test and they had a bilateral strength ratio of 0.90 in the “T” and “Y” positions. Now, if you were to follow commonly used lower extremity guidelines, which consider a 10% strength deficit between injured and non-injured limbs acceptable to return to play, based on your results you would say this athlete has adequate strength to return to sport.
However, if we look at our table of ratios, we would see that we’re actually sending this athlete back with a whopping 20% strength deficit compared to their healthy teammates! Higher risk for potential re-injury, no doubt. There are plenty of other factors to consider when clearing athletes for return to sport, but without healthy baseline or normative values, we have very little information to base our decisions on, which is why objective data and continued research with this test are crucial.
A 7-10% Difference Between Dominant & Non-Dominant Arms is considered the standard in healthy NCAA DII collegiate baseball pitchers.
But...Performance?
Up until now most of what we’ve talked about is healthy baselines and use-cases for injury rehab, but does the test tell us anything about how well an athlete might perform??
Unfortunately, what we’ve found in baseball pitchers so far is that none of the peak force values (or bilateral ratios) are related to fastball velocity. That shouldn’t discourage us though because it is totally possible that the ASH test is correlated to performance in other sports or other populations. Plus, if we think back to what I wrote about in Part 1 of this blog, there are tons of other metrics we can look at in the ASH test that might be related to fastball speed such as rate of force development, time to peak force, standard deviation in force, etc. It might also be the case that ASH test results are related to endurance, injury risk, or other sports performance aspects we have not looked at yet. Again, I encourage you to investigate these things in the athletes you work with to discover what other uses might be out there for this test.
-png.png)
Figure 3: MLB Baseball Pitcher
Conclusion (Part 2)
We’ve covered a lot of data in this blog, but hopefully, it gives you a deeper understanding of how the results from this test can be used in the real world with some good starting points for looking at arm health in throwing athletes. There are also limitations to this test that we haven’t had the chance to discuss, but that’s why it’s just one of the tools we should have in our toolbox for assessing athletes. However, I don’t think anybody prefers to guess about something they could have measured, so, equip yourself with this information and start exploring what the data tells you in your athletes!
Note: Figures 1 & 2 are modified from the original article from Ashworth et al. 2018.
-
If you have questions about this article, Aaron can be reached at aaron.trunt@sanfordhealth.org
-
Part 12 of the ASH Test blog series by Aaron Trunt can be found here.
Sources:
Explore Other Upper Body Assessments Here