Communicating Results The Hawkin Cloud enables users to build visually appealing and digestible reports. Reports on (1) ...
Communicating Results
The Hawkin Cloud enables users to build visually appealing and digestible reports.
Reports on (1) individuals, (2) groups, or (3) entire teams are available.in seconds (6 clicks of the mouse)
Our entire system at Hawkin is built around the user. Since the nature of sport is very fluid, we created these reports so that coaches and other users can easily print and share them with other key members of the performance staff.
Easily share these reports with your:
- Sport Coach
- Athletic Trainer
- Physiotherapist
- Athletic Director
- Athletes
The choice is really yours, we just provide the report.
Have a report that you currently use within your organization? If we like it we may build it into our software for you - email us at drake@hawkindynamics.com.
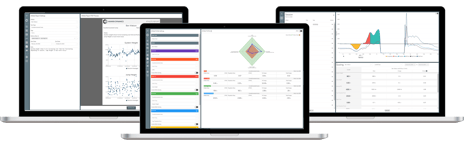
Visual Reporting Options
In the Hawkin Cloud (our software) there are 3 reporting types:
A. Trend Report (trends overtime from an individual, group, or team)
B. Athlete Profile (profile with a radar chart or bar graph - choose any assessment & 3-6 metrics)
- profile an athlete against his/herself, the team, or a select group
C. Comparison Report
- compare an athlete against his/herself, the team, or a select group between two time periods
- this can be useful when looking at the changes in performance with between training blocks, readiness day-to-day or week-to-week, or year to year improvements.
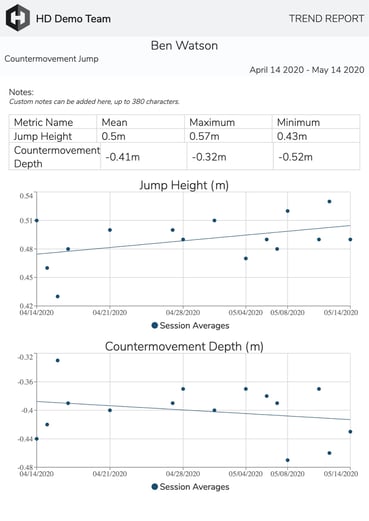
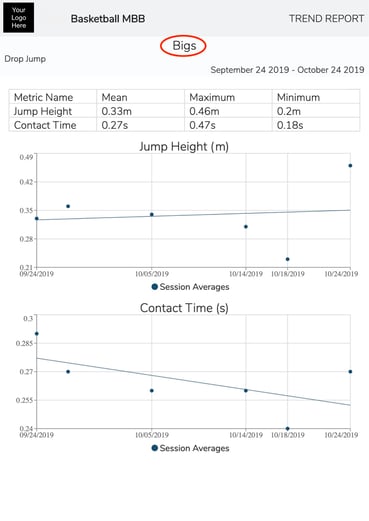
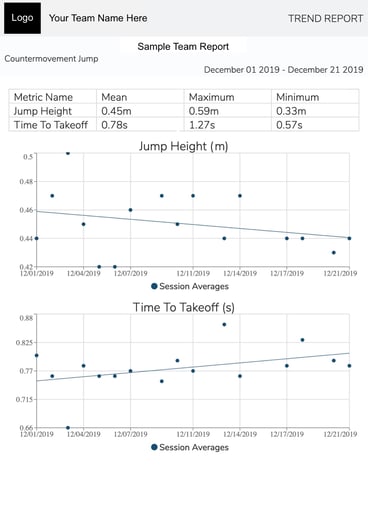
(A) What Do Trend Reports Look Like?
Individual Athlete Trend Report
Custom notes can be added to easily communicate between other members of the staff.
Group Trend Report
(Example: guards, forwards, middle hitters, return to play)
Team Trend Report
(B) What Do Athlete Profiles Look Like?
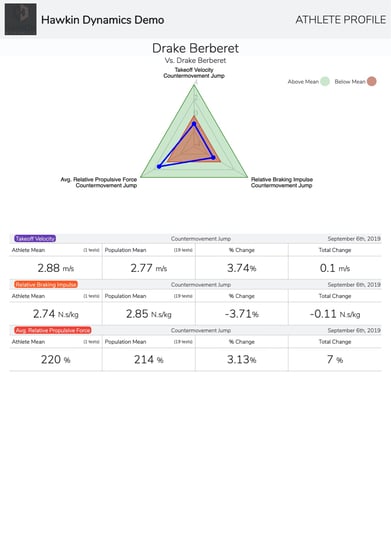
Athlete Profile (Radar Chart Option) compared to self
This image shows 3 metrics for the CMJ, you can choose up to 6 metrics & multiple tests (i.e. SJ, isometric)
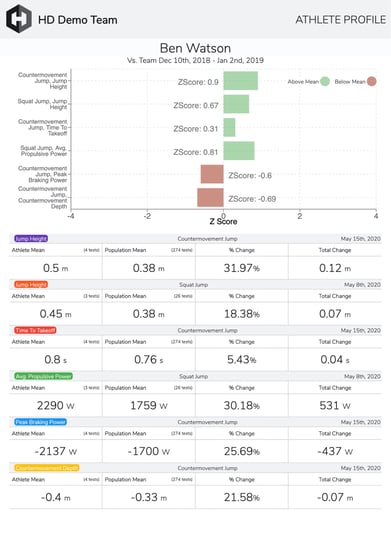
Athlete Profile (Bar Chart Option) compared to team
6-metric option selected (select from 1-6)
(C) What Do Comparison Reports Look Like?
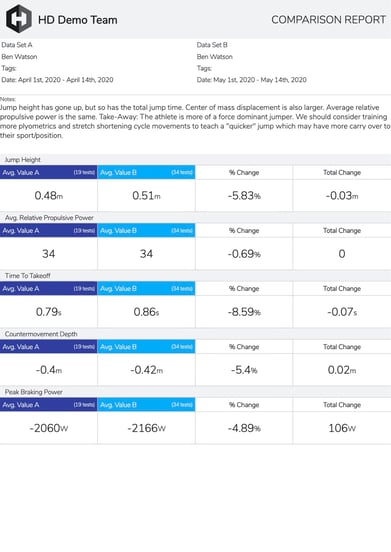
Comparison Report (comparing self to self) between the months of April and May
You can also compare an athlete to a group or team. Comparison dates are fully customizable.
Custom notes are also available here.
Navigating the Cloud
Here is a video that will show you how to generate reports from the Hawkin Cloud.
Have questions about these reports or want to schedule a free virtual demo to see how the cloud works in real-time? Contact us at info@hawkindynamics.com or message us on Instagram.