-2.png?width=156&height=60&name=Hawkin%20Logo%20(2)-2.png)
.png?width=300&name=TSA%20Report%20(1).png)
What is the TSA Report?
TSA stands for Total Score of Athleticism. The concept was originally developed by Anthony Turner and colleagues out of Middlesex University (UK) in a paper titled Total Score of Athleticism: Holistic Athlete Profiling to Enhance Decision-Making which was published in the NSCA Strength & Conditioning Journal in December 2019. In this paper, the researchers make the point that this score is a way to holistically stack athletes up against one another using the inputs you like, and then compile those inputs to give one clean number as the output. This output is the TSA Score. In the Hawkin Dynamics System, your inputs will be a test type and an accompanying metric (i.e. Countermovement Jump & Jump Momentum). You can select 3-7 of these test/metric combinations to compile one complete TSA Score.
Reading a TSA Score
A TSA Score can be calculated using both Z-Scores (values -3 to +3) or Scaled Score (values 0-100). Both will tell you the same thing, just presented differently. When using the scaled version the values will be positive only, which some users and coaches prefer. A value of 50 is the mean, a value of 0 is the absolute worst, and a value of 100 is the absolute best. If an athlete obtains a perfect TSA score of 100, that would mean that they are the best in all selected inputs.
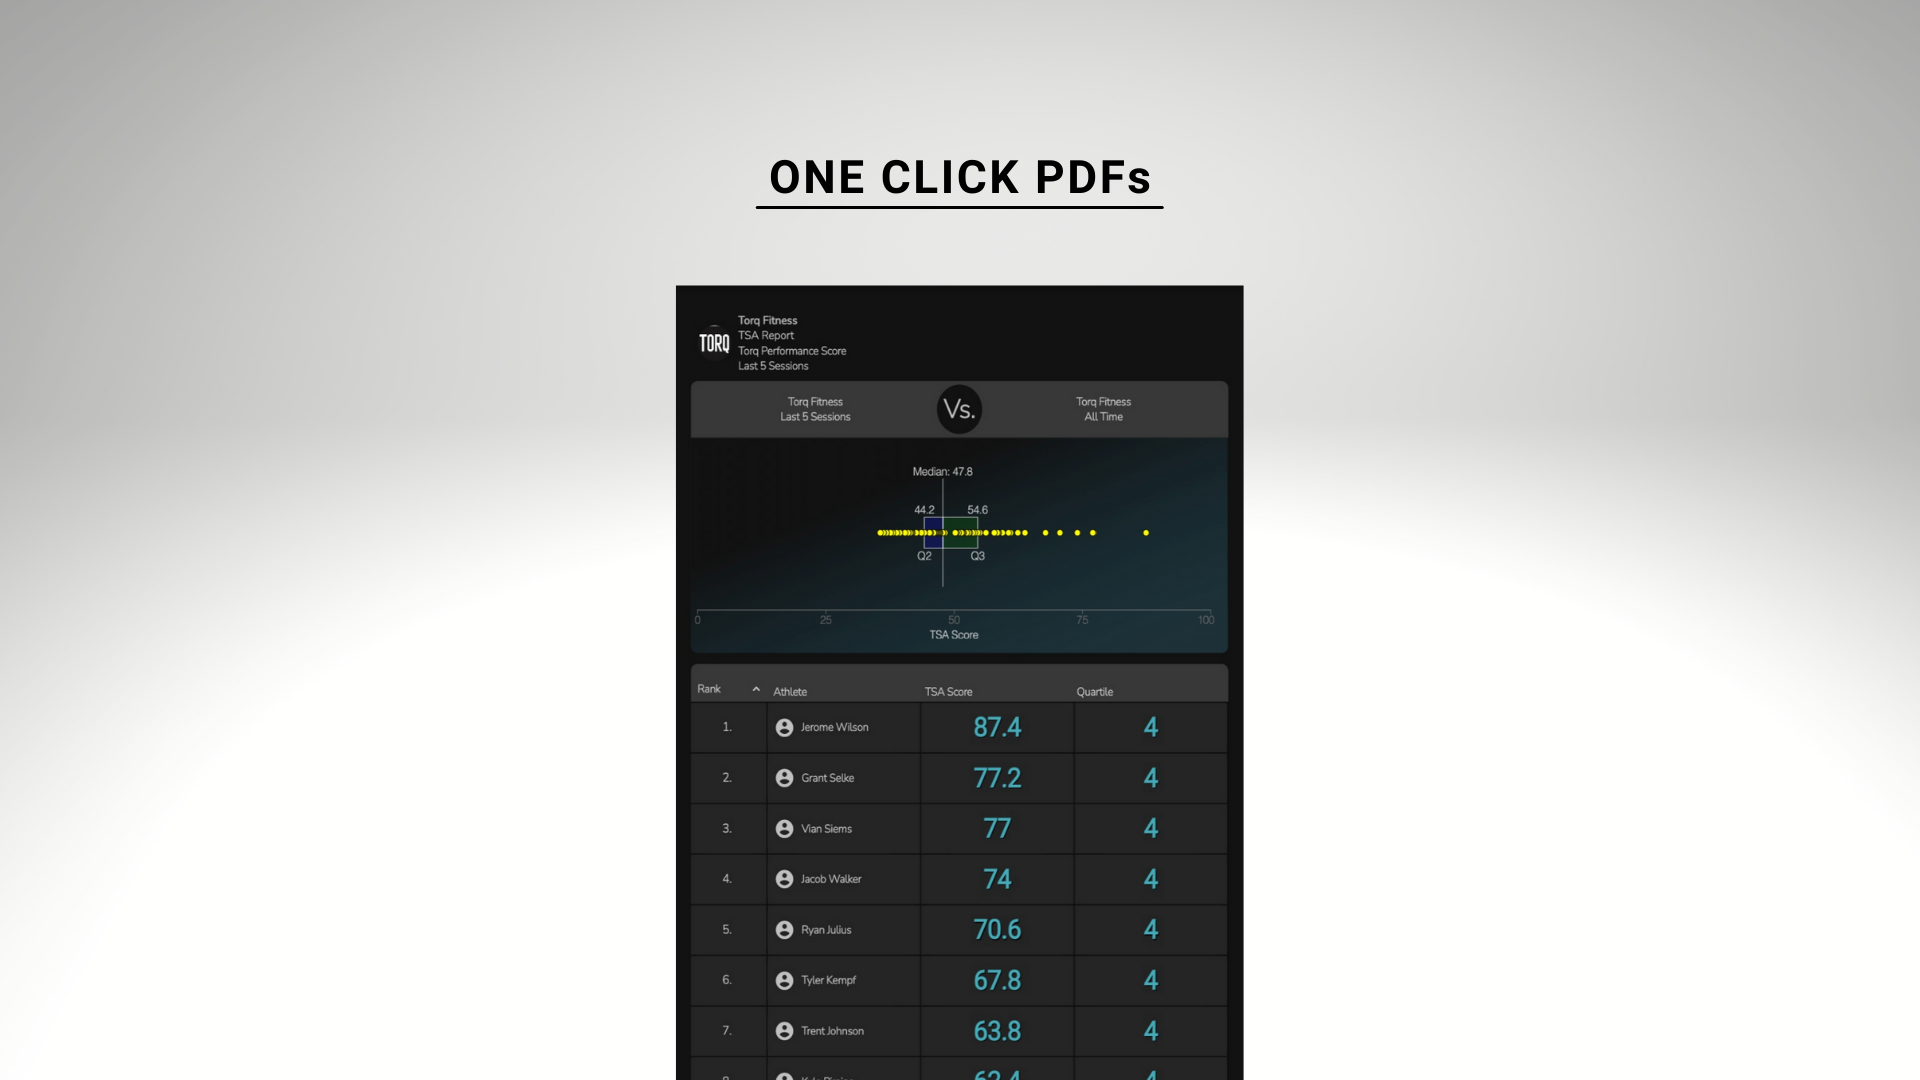
Scaled: With the Scaled Score version (as shown below in Figure 1), the athlete that is ranked first is the "best athlete" within the population for the tests/metric combinations you selected. His value is 87.4.
Z-Scores: Presenting the TSA Score as a Z-Score will give you values in the range of -3 to +3. The athlete that is ranked number one will still be number one, however, the TSA value will be +3 instead of 87.4, a different way to present the same data.
*Note* It's important to know which population you're generating the score from. To the right of the "Vs." on the laptop below you will see the population "Torq Fitness All-Time". This was selected in settings in the middle/bottom of the laptop. Within this bigger population, the coach wanted to see where athletes stacked up only from the Last 5-Sessions only. Therefore, "Torq Fitness Last 5-Sessions" was selected in settings to score against "Torq Fitness All-Time", and can be seen to the left of the "Vs." on the laptop.
Explaining this with numbers, let's say that Torq Fitness has 15,000 total data points in their organization. Whereas Torq Fitness Last 5-Sessions only has 100 data points (each player tests 10 times within this period). Each players individual score is from the Last 5-Sessions, then scored against the Torq Fitness All-Time data (the much bigger data set).
.png?width=1600&name=TSA%20Report%20(1).png)
Figure 1: The TSA Report in the Hawkin Dynamics Cloud Software
How is it Calculated?
There is no proprietary algorithm for the TSA Report. It is simply calculated by taking a score for each test/metric combination and doing the same for the other combinations. Once each test/metric combination has a score, the scores are then added together and divided by the number of combinations you select. This is all completed on-demand in the Hawkin Dynamics Cloud, requiring minimal work on your end.
Which Inputs Should I Use?
The inputs are the test/metric combination that you choose.
You can select between 3-7 combinations. An example combination is Countermovement Jump (i.e. test) and Jump Momentum (i.e. metric). You must select at least 3 combinations for the TSA Score to be calculated. There are no best metrics to use for this report. You should include tests and metrics that fit with the population that you are comparing. For example, a basketball population might include CMJ & Jump Height, CMJ & mRSI, IMTP & Relative Peak Force (BW), IMTP & Force at 250ms, and Drop Jump 30cm & mRSI. These were selected because basketball is a reactive sport, that also requires a level of relative strength so that the athlete doesn't get pushed around in the paint. On the contrary, in a sport like Tennis, it might not make sense to use the same inputs to compile the TSA Report because there is a much different level of physicality involved. Instead of using the IMTP for Tennis, maybe you use the CMJ Rebound and report back L/R Average Landing Force between the two CMJs, and also mRSI during the second CMJ. Now you have combinations that help tell you something about the athlete with respect to their sport (i.e. Tennis is the prevalence of ACL injuries and reactivity in the sport).
Reading the Graph
For this graph, we chose to go with a box & whisker plot. In this plot, athletes are broken up into 4 Quartiles. The athletes that fall into Q3 and Q4 are above the median for the population, and the athletes that fall into Q2 and Q1 are below the median. The top-tier athletes will fall into Q4, and be further to the right. For example in Figure 1 above, one athlete is much further to the right (i.e. outlier). This athlete is much better than the rest of "Torq Fitness" for the selected tests/metrics, and is the best athlete in the organization. If a datapoint was to the far left, this athlete would be significantly worst than the population and limited physically, or has an underlying issue that is limiting the output values.
Data Distribution
If you look above at Figure 1, this dataset is right-skewed, meaning more data falls on the left side of the median. The opposite would be true for a left-skew. If the dataset is symmetrical (normally distributed) the box plot would fall in the center of the graph. Figure 2 below shows these.
-1.png?width=831&name=MicrosoftTeams-image%20(3)-1.png)
Figure 2: Distribution of data examples.
When Would You Use The TSA Report?
Some common use cases for the TSA Report are:
-
University Setting: Ranking Athletes at the start of the school year. This is commonly done when a university wants to run all the athletes through the force plates along with their medical evaluations. It's also a good idea to do this pre-season as well. Done consistently for 4 years, and you have four values to compare year to year. If you are a new organization with Hawkin, start by using all of your student-athletes as the comparison population to score against. As you build out your database, narrow it in and use each sport as the comparison population.
-
Professional Setting: When the athletes return to camp gather a TSA Score on each of them, and compare that to the TSA Score before they left for the off-season. Gather another TSA Score right before the season starts.
-
Tactical Setting: If you are running a bunch of recruits through the system, the TSA Report is a quick report to get one clean number for each recruit.
-
Private Setting: We work with a lot of private facilities that do off-site testing as a way to make additional revenue, and market their training services to new athletes/parents. The TSA Report can be used to profile a group (i.e. the AAU team you went to test) against your current population at your gym (i.e. Torq Fitness). Print those PDFs and disperse to the head sport coach of the team and parents to incentivize them that they need to get into your facility.
Conclusion
The TSA Report is not an end-all-be-all report. However, it is an easy way to compile a clean number to label athletes against one another. By selecting tests and metric combinations that help explain multiple qualities of the sport and position, your TSA Report will become more robust. In the Hawkin Cloud, there are other ways that you can profile, such as the Quadrant Report and Profile Report (i.e. Radar Chart). Choose the option that makes the most sense for you, the people you work with, and the logistics of your organization.
Need help setting up your TSA Report?
Contact us below and one of our sports scientists will reach out!