-2.png?width=156&height=60&name=Hawkin%20Logo%20(2)-2.png)

Test View Refresh
We've finally unified our "test view" across all pages of the web app! Previously there was one view for session-view/activity feed with the raw data and the "little wheel" that showed the weighted score (z-score weighted against whichever population you had selected. Now you can see this score but in a new layout:
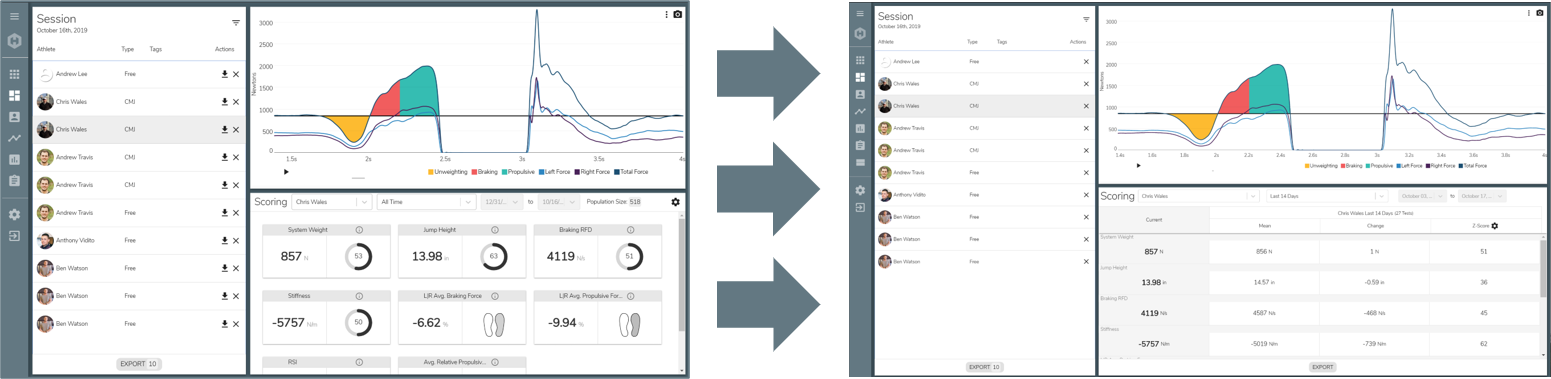
The new table view below the trace is designed to give you instant access to scores (you can now select a traditional z-score (-4 to 4) OR a weighted score as well! Our goal is to unify the views in the web but also to give users more control over how their data is displayed. For a detailed view of the new table:
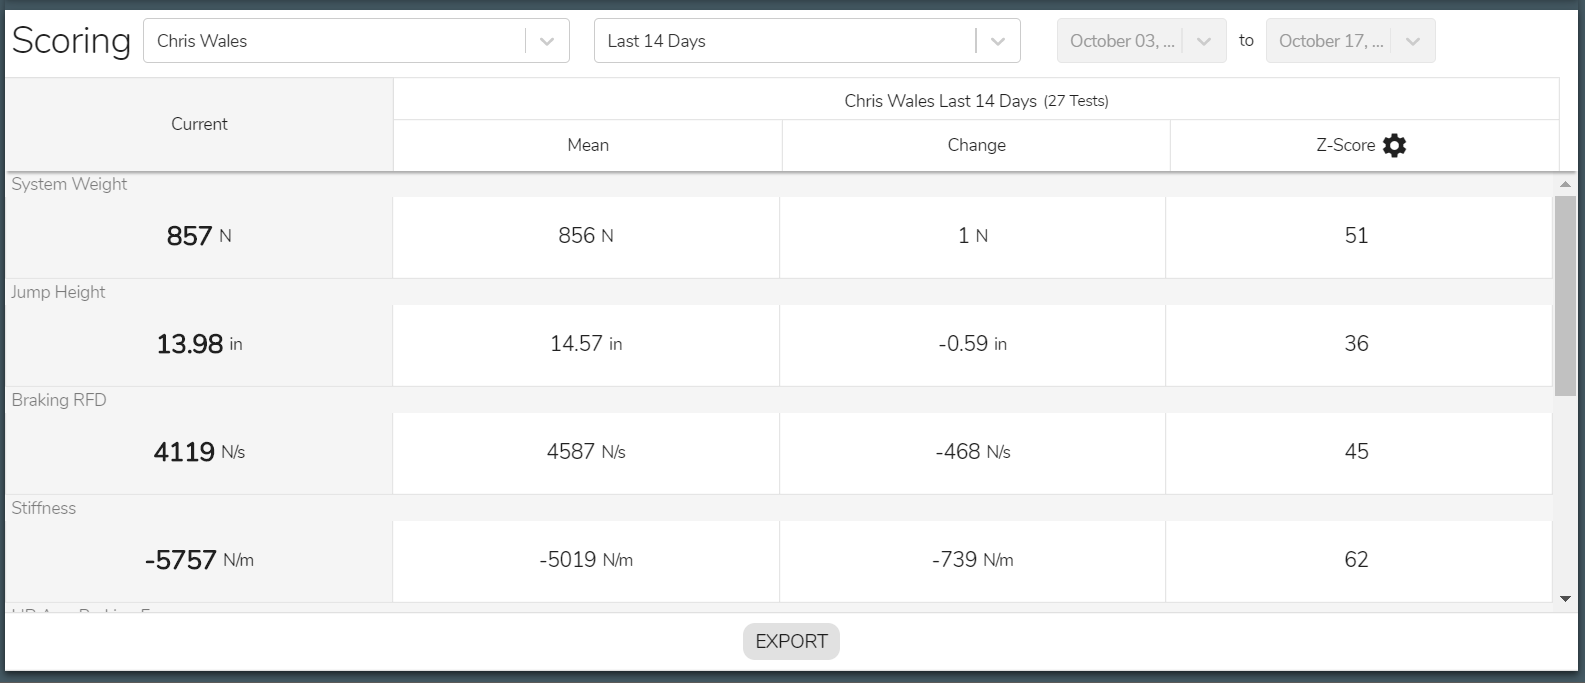
You can now select some "pre-set" time periods for your population and also see the actual mean value for the selected population AND its actual difference from the test you are viewing. As seen below Chris' jump system weight was 857 Newtons, and his mean for the last 14 days is 856 N, so the "actual change" is 1 Newton. This translates into a "weighted z-score" of 51. Simple enough, but we hope that this new view makes more sense for users.
Trend Reports
You'll likely notice the new "reports" tab in the left-hand navigation menu. We've mentioned this before, but our goal is to simplify navigation in the web app and make things more logical and usable for our users. The new report tab will be your "go-to" spot for building and exporting data in ways that are visually useful and clear. Of course, you can still always export your .xls files and sessions (even an entire team's dataset at once) from the main dashboard, but we think of the reports as a more visually rich and "ready to go" tool. The first report we are releasing is a basic "trend report" that enables you to view changes in a few metrics for any athlete over any period of time:
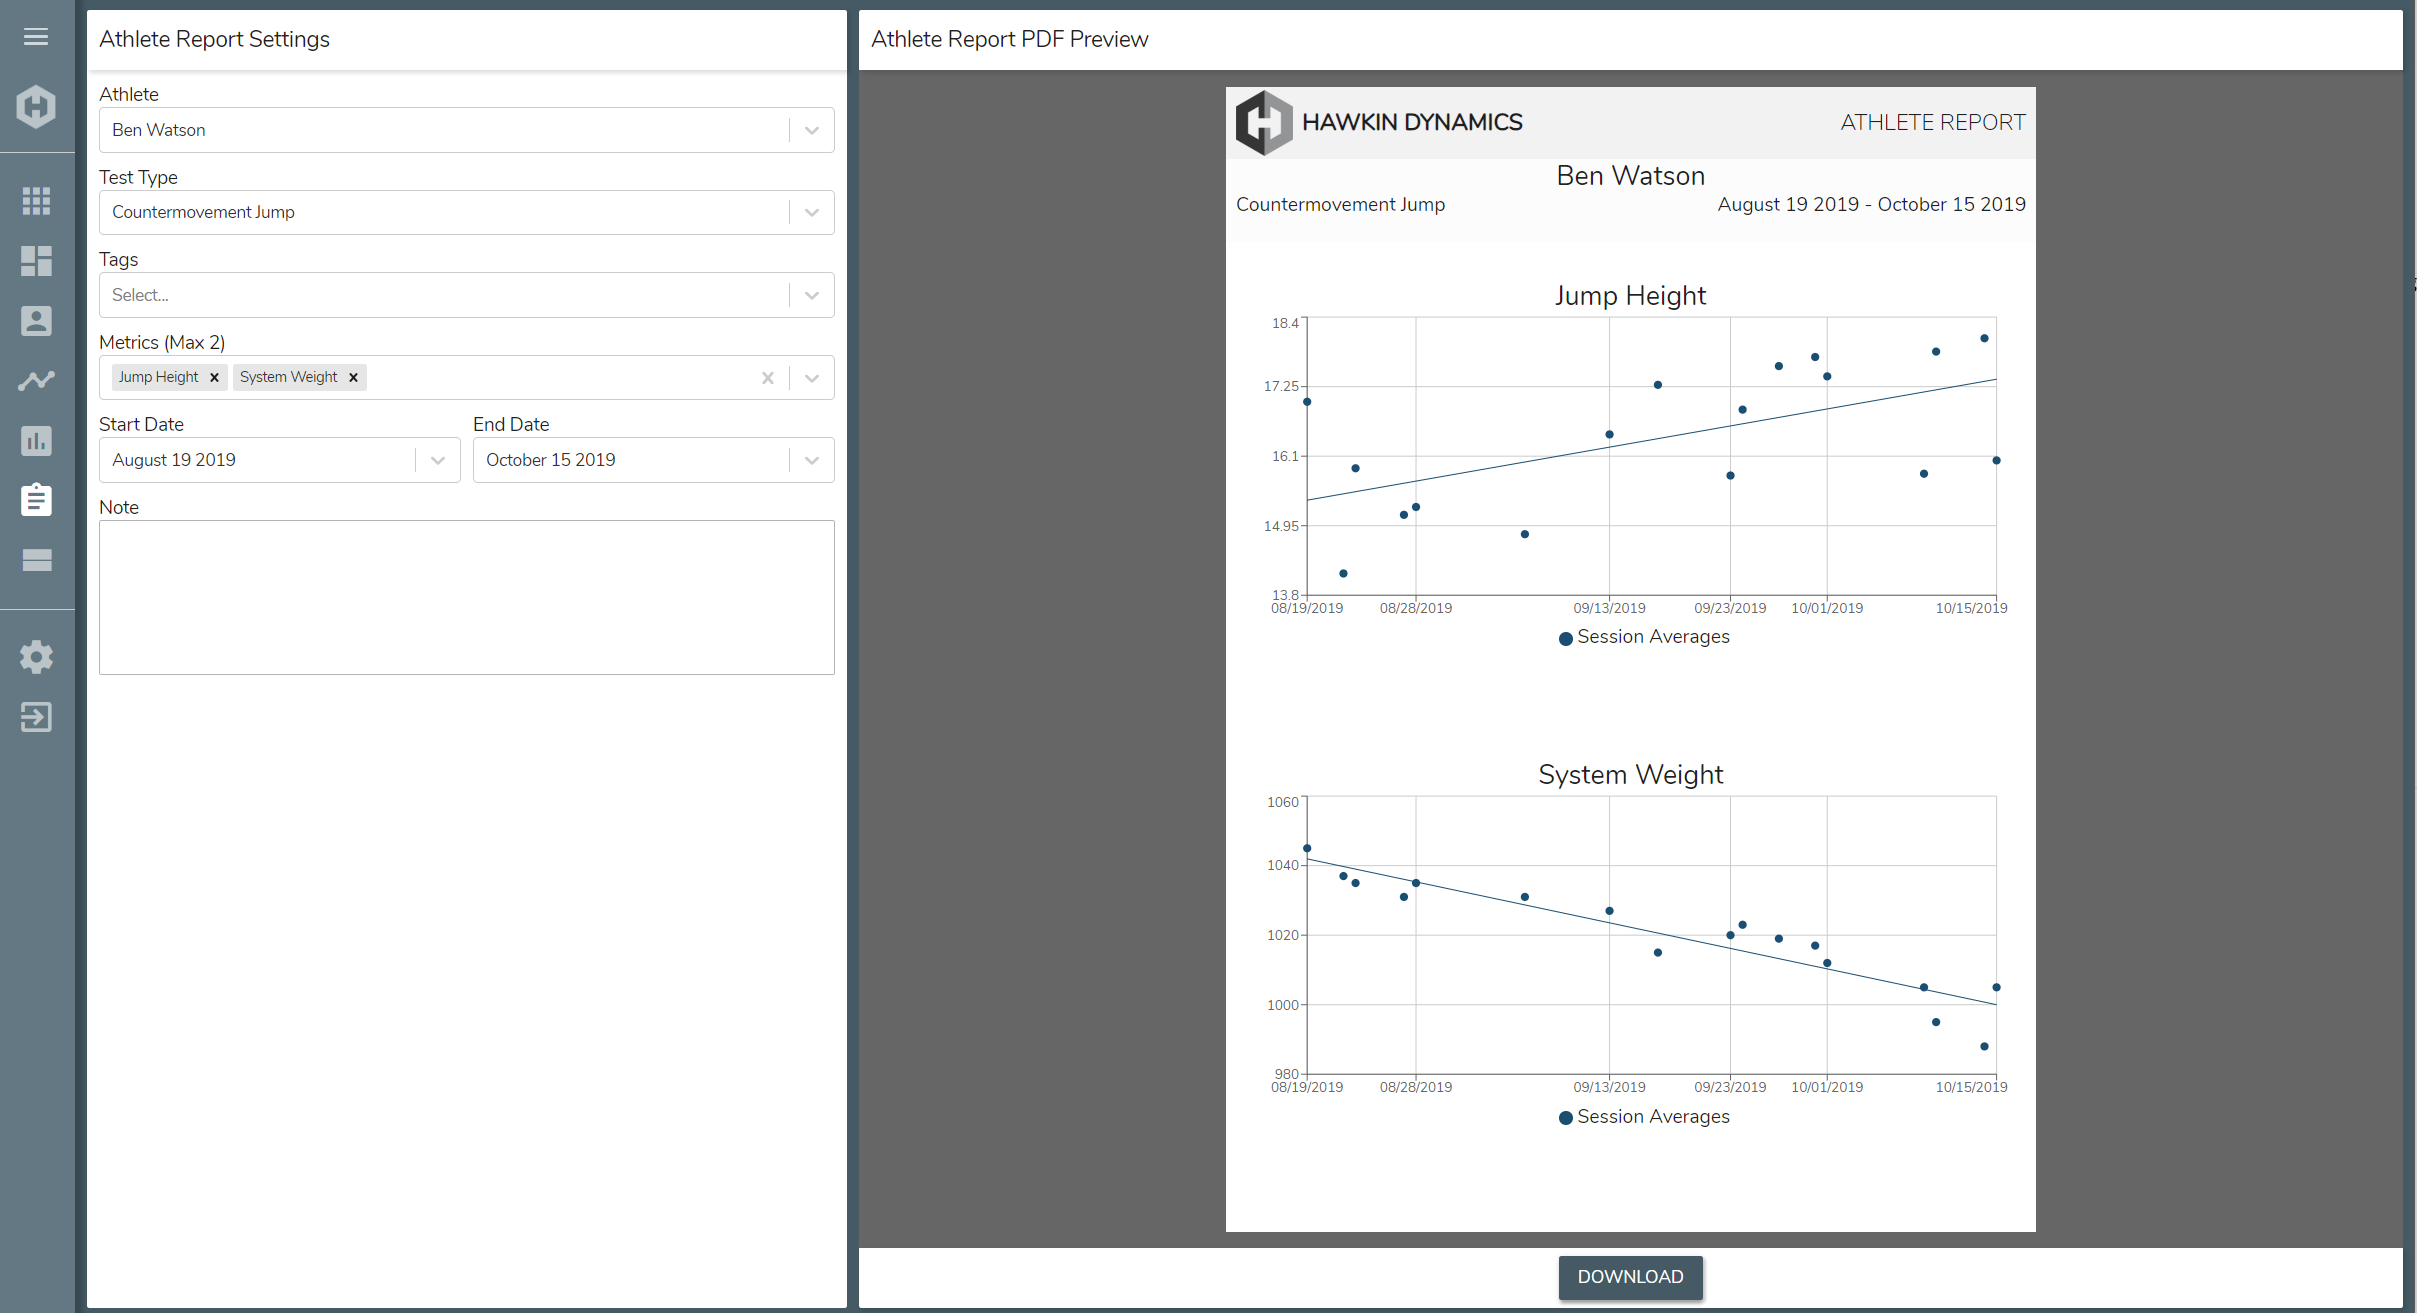
You can create a report for individual subjects, one at a time (for now). The report downloads as a .pdf and includes the data you've selected in the left-hand menu. This is a great way to visualize change over time in a quick and simple way. We're working on a team/group/multi-athlete version of this report and should have that ready soon! Remember this is only the beginning.
Looking forward to updating everyone with the next updates soon!