-2.png?width=156&height=60&name=Hawkin%20Logo%20(2)-2.png)

Today we are releasing a new update to the cloud dashboard. We have completely reworked the navigation for the dashboard. This change will hopefully allow you to get where you are going faster and more intuitively:
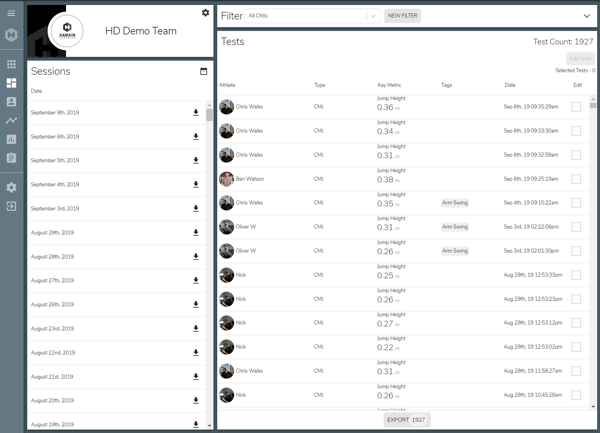
Every place in the dashboard is now accessible from this top-level navigation and the individual test view now includes more contextual data than the previous version. You can still pick a comparison population and data range but we give you the mean, the change from the mean, and the Z-Score for each of your active metrics. By clicking on a metric, you will be able to see in the secondary graph, the current test compared to the athletes previous session averages for the metric. This allows you to see the trend and where the current test falls in relation to that trend:
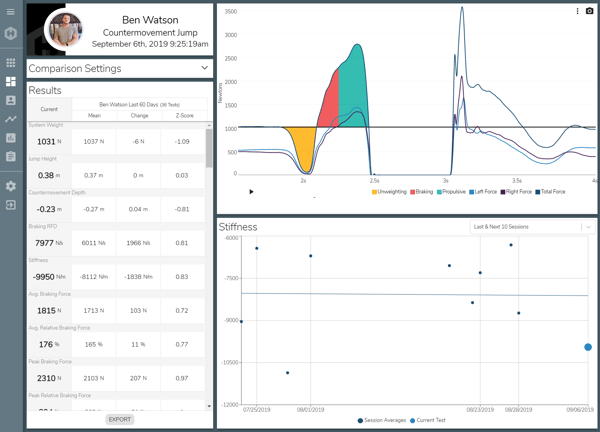
The export also includes an option to export the comparison data in addition to the current test data. We have added a Reports section which initially includes the Scores & Averages report which was previously the individual athletes page.
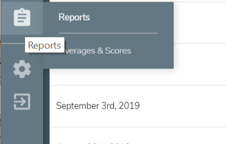
A lot of great new reports will automatically become available here as they are completed so stay tuned! We always love to receive customer feedback, please do not shy away from suggestions or ideas that you think might help to improve the system!
We're going to have some new product announcements in the coming weeks/months so keep an eye out for those as well.