-2.png?width=156&height=60&name=Hawkin%20Logo%20(2)-2.png)

Upper Body Isometric Strength Testing (Part 1)
Guest Post By: Aaron Trunt, MS – Lead Biomechanical Engineer, Sanford Sports Science Institute
Read the original research article by Aaron Trunt here.
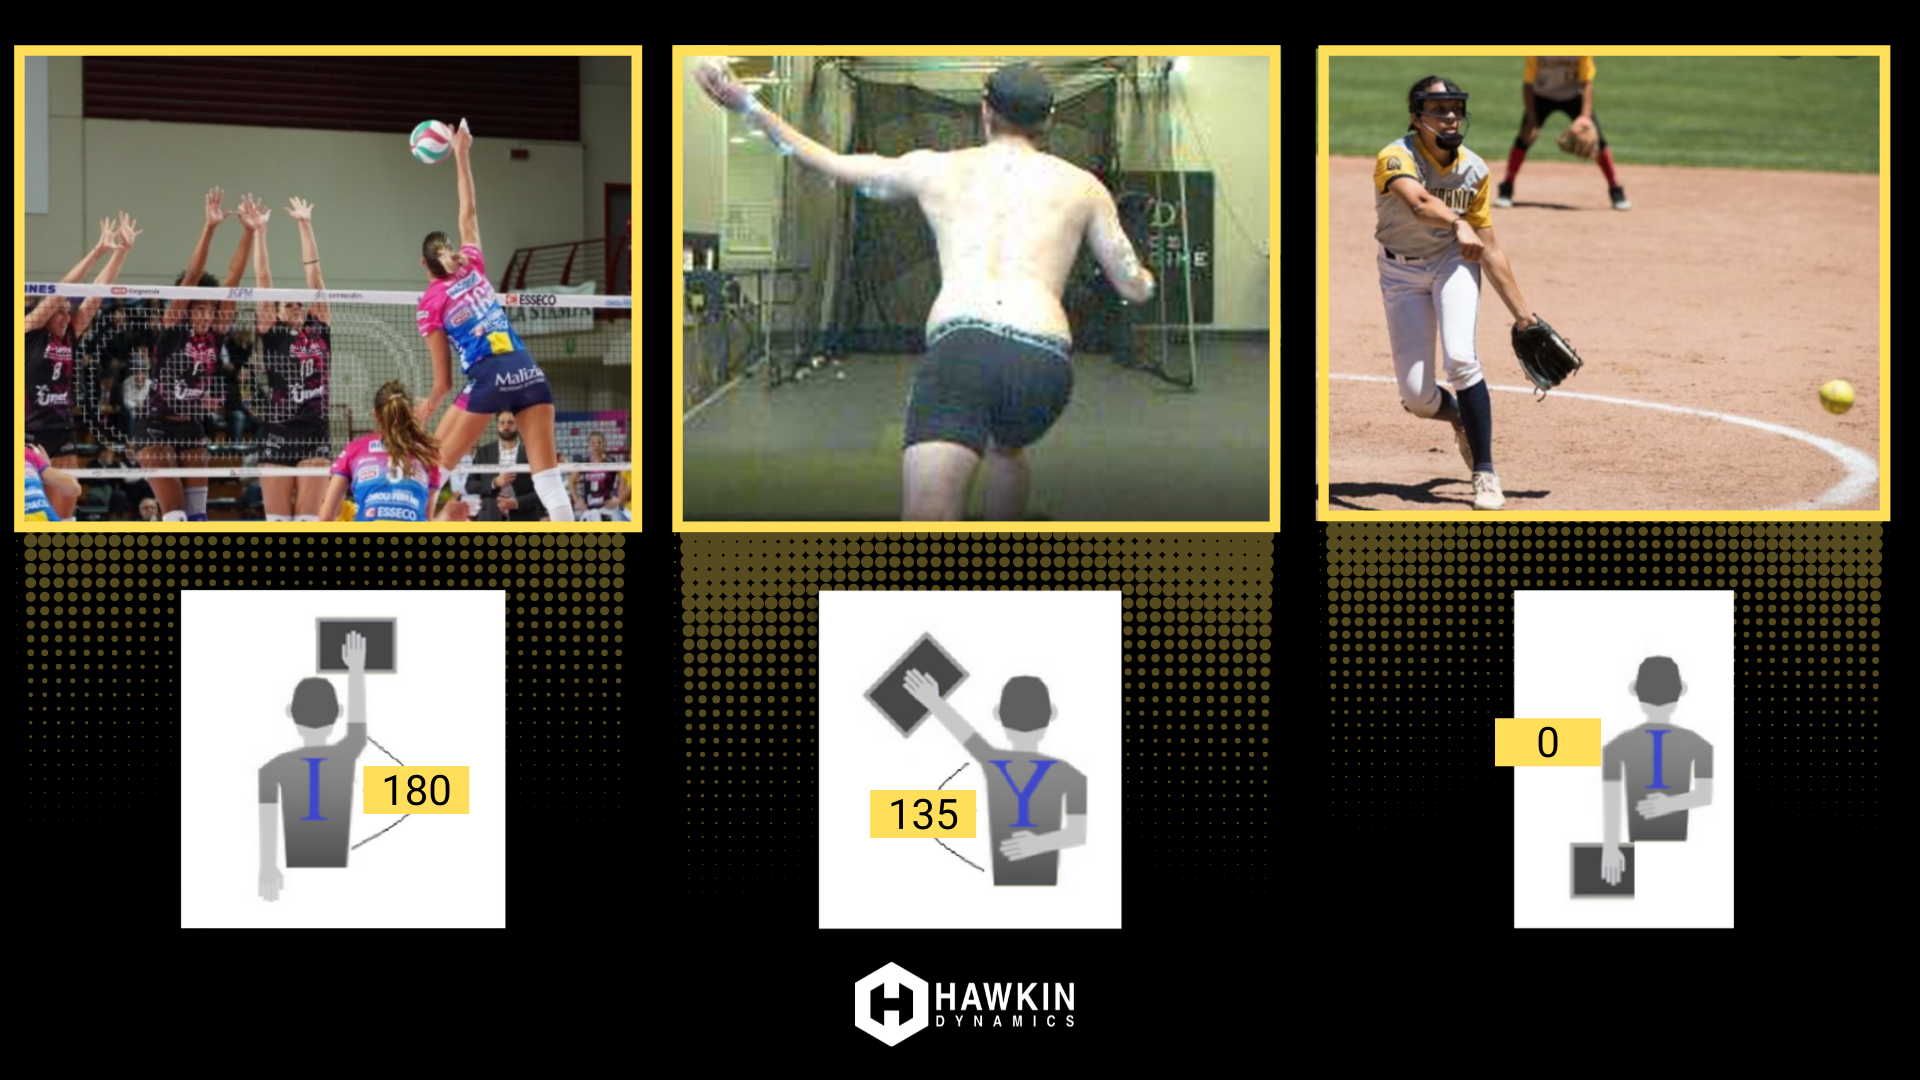
Figure 1: Volleyball, baseball, and softball shoulder angles in sports movements.
Introduction
Lower-limb assessments of strength and function are extremely popular in the world of sports science, specifically in the fields of rehabilitation, strength and conditioning, and sports performance. This is largely due to the high prevalence of lower-limb injuries in sports, such as ACL tears, as well as the numerous tools and methodologies available to assess an athlete’s lower body strength and function. However, when looking at the upper extremity, there is a lack of relevant and objective tests to determine strength and function, especially when compared to the lower extremity. This lack of tests can somewhat be attributed to the complexity of the shoulder joint and associated injuries, but it has not stopped scientists from searching for new ways to examine the upper extremities using existing technologies.
The Inception of the ASH
Back in 2018 a paper was published by a group out of the UK titled “The Athletic Shoulder (ASH) test: reliability of a novel upper body isometric strength test in elite rugby players”. The idea behind the study was simple: is there a reliable way to measure upper extremity strength in a similar way that so many already measure the lower extremity? The answer, it seems, is a resounding ‘Yes’. This initial study, conducted on elite rugby players, found that using a portable force plate to measure isometric shoulder girdle strength (peak force) was very reliable with low inter-day error. These findings are not surprising given that force plates are known for their high validity and reliability, but nonetheless it appears we now have a trusty and objective method for measuring UE strength.
So how is the test administered? I recommend you read the original article for a more detailed explanation of the protocol (linked at the end of this post), but in brief: the test is performed with the athlete in the prone position on the floor with whatever arm to be tested resting on the force plate fully extended (figure below). Note: if there is a large height difference between your force plate and the athlete this may cause the test arm to be in a relative degree of horizontal abduction (hand above the shoulder blade), I recommend raising the athlete so the hand is in line vertically with the shoulder. A verbal or audio cue is then given to the athlete to push into the force plate with their hand as hard as possible for 3 seconds. After a short break, the athlete performs this test again for a total of 3 trials at the given test position. The test is classically done at 3 separate levels of shoulder abduction, the “I”, “Y”, and “T” positions corresponding to 180, 135, and 90° of abduction, respectively. The reason for various test positions is due to the numerous small muscles spanning the shoulder girdle that each have different force contributions depending on the position of the arm, so testing all of these positions give us a decent picture of how all of these muscles produce force. At the Sanford Sports Science Institute (SSSI), we have been exploring using a fourth test position at 0° abduction.
Although it might be tempting to only test an athlete’s dominant arm, or in the case of overhead athletes like baseball players, the throwing arm, I strongly recommend testing both the dominant AND non-dominant arm (rationale coming soon).
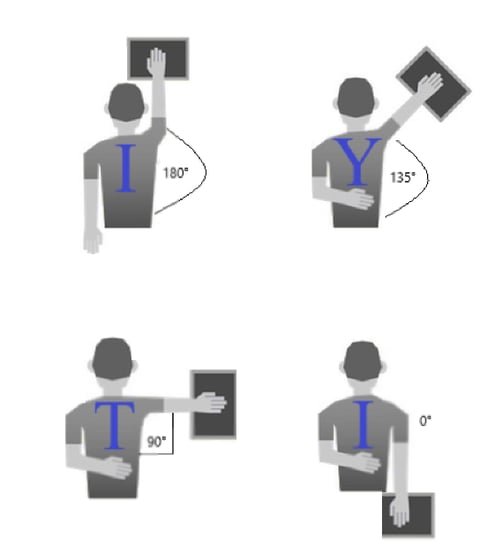
Figure 2: Modified from Ashworth et al. 2018
What do the results look like?
If you’re familiar with other isometric tests like the isometric mid-thigh pull (IMTP), these results look very similar. Once the test starts, the force curve increases rapidly and maintains near-peak levels until the test is completed. The main variable of interest is peak force – how hard was this person able to push into the force plate at the given position? Thus, maximal intent and effort are crucial to get a reliable value. The existing research is mostly on rugby players, but our group at the SSSI is breaking the ground with published research on baseball pitchers and athletes recovering from UE injuries. I’ll provide the results from some of our research in my next blog (Part 2).
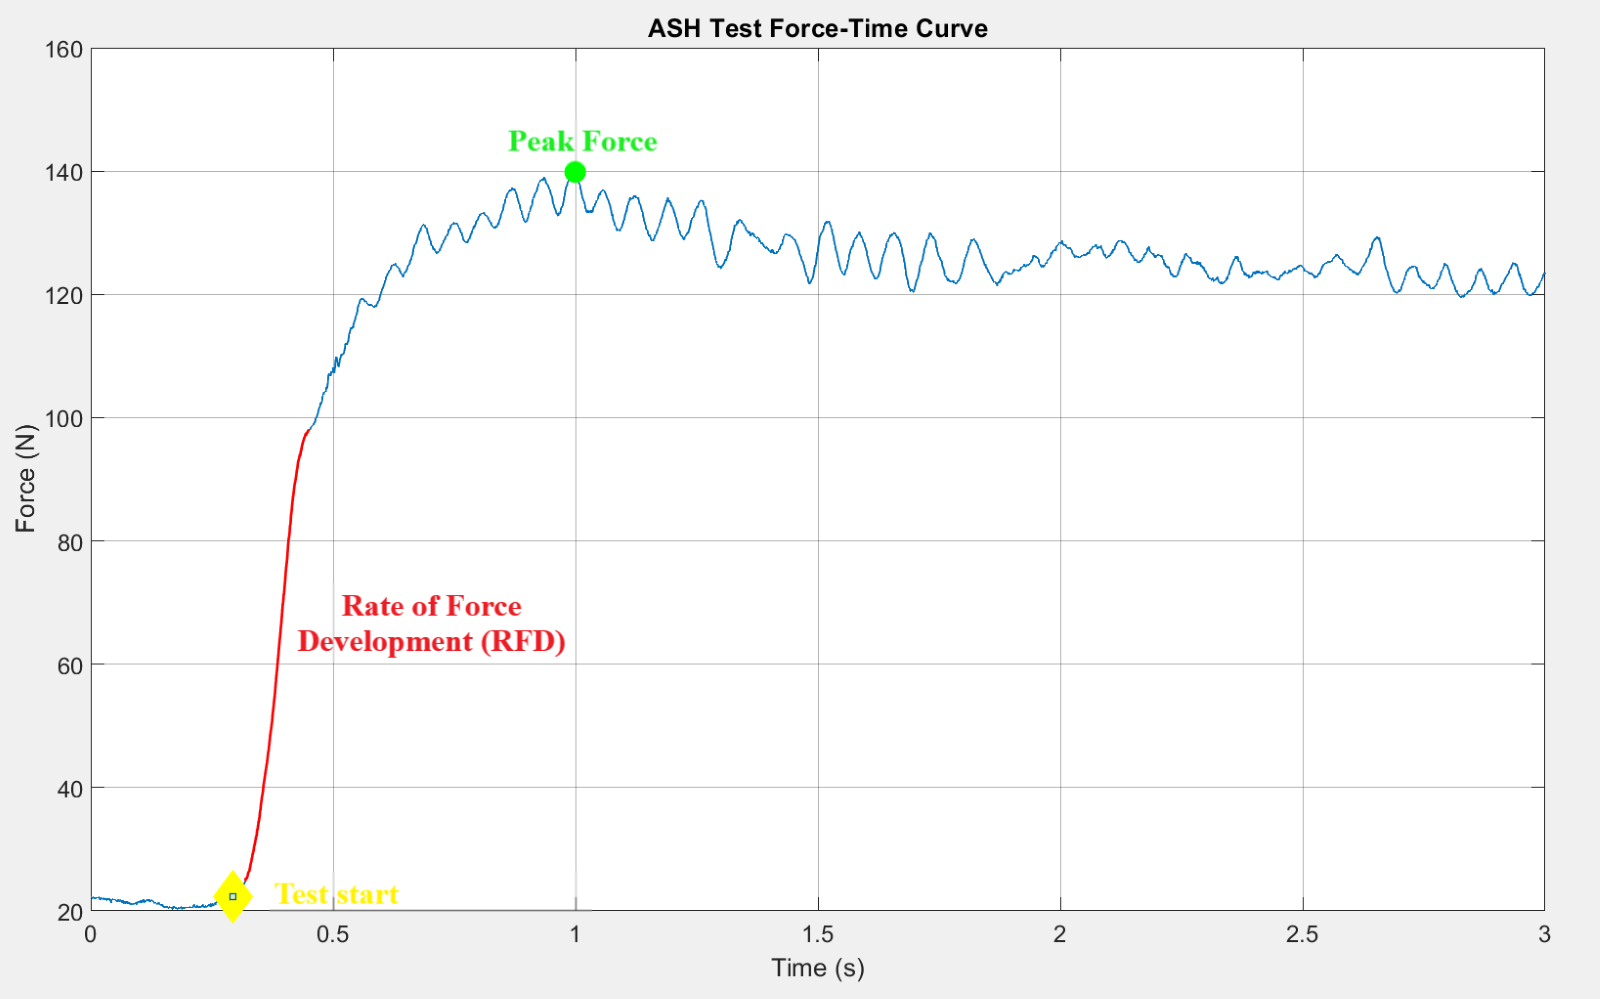
Figure 3: ASH Test Force-Time Curve on a Force Plate
Okay, so we know what the test is, we know how to administer it, and we know what the output looks like, but you’re still probably asking: how do I incorporate this into my regular athlete testing routine? Since the test is new and normative data doesn’t really exist, there’s no concrete rules for how and when to use the test, but I’ll give my recommendations having used the test regularly for a couple years now.
Consideration 1: Time
“I don’t want the test to take up a lot of time, what’s the one test position I should use to get a good idea of my athlete’s shoulder health?”
I get asked this question a lot, but the answer is dependent on the group you’re working with. For example, a volleyball player is primarily playing with their arm(s) straight overhead in that “I” position so it makes sense that that is the one position we’d like to test, but a baseball pitcher is throwing anywhere from 80°-100°+ of shoulder abduction so it makes more sense to test them in the “T” or “Y” position depending on their arm slot. Or maybe you’re working with softball pitchers who have almost no shoulder abduction when they throw, then you might want to use the other “I” option. In the name of specificity, test the most relevant position to the athlete in front of you.
Consideration 2: Frequency
“How often do I test my athletes with the ASH?”
The jury is definitely still out on this one, and again I think it depends on the athletes you’re working with. For instance, at the SSSI we use the test as a pre-season baseline for our throwing athletes and as part of a test battery for overhead athletes looking to return to sport following injury. Those are two cases where there is definite value, but there are countless others. Some interesting ideas that come to mind:
-
Having a healthy baseline on an overhead athlete and then testing them again after competition to quantify fatigue and inform training for that day (you could even test the day of competition to evaluate readiness).
-
Routine monitoring during training or an on-ramping throwing phase to make sure our athletes are able to handle the training volume.
-
Periodically during youth/adolescent development with thresholds to serve as guidelines for when training can be progressed. An example of a guideline might be: We don’t let our young baseball players throw weighted balls until they hit "x"% bodyweight of peak force on the ASH test.
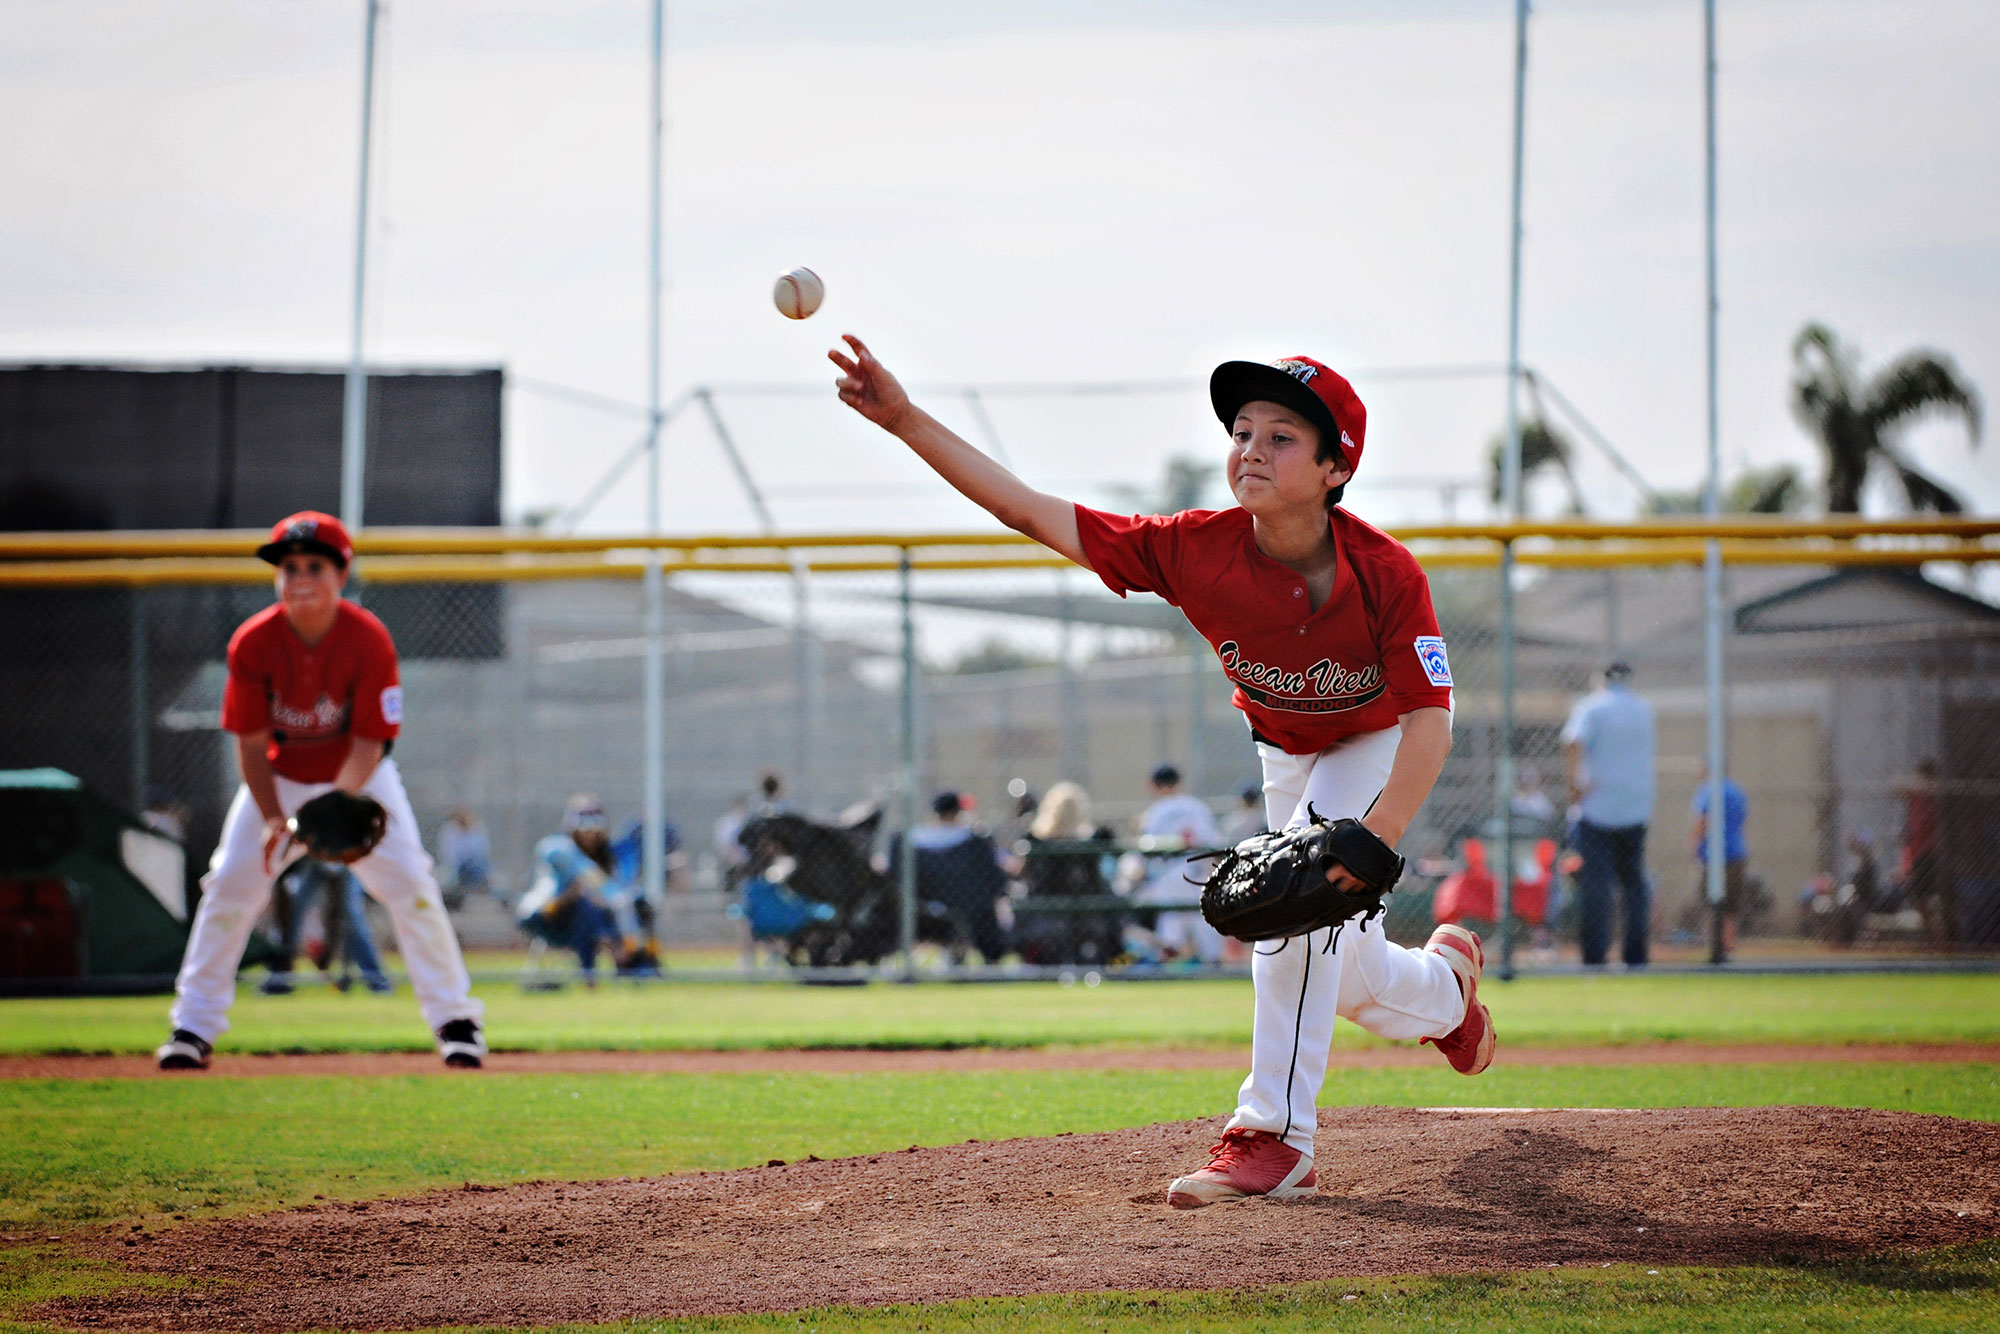
Figure 4: Youth baseball pitcher pitching in the Little League World Series
Other Options
In my opinion, the best part about the ASH test is all the unexplored data that gets collected as a byproduct. Think about it, we’re using a force plate to capture 3 seconds worth of data and right now we only look at one value: peak force. But there’s infinite other things we could decide to look at that might be even more important! Some more examples:
-
Rate of force development (RFD): the speed at which an athlete can produce force, this happens right after test onset and is represented by the red line in the graph above.
-
Time to peak force: the absolute time, in seconds, that it takes an athlete to get to their peak force production. This shares similarities with RFD but can vary greatly from athlete to athlete.
-
Force Drop-off: if you did repeated tests you could look at muscular endurance by seeing how long it takes before an athlete’s peak force drops below a certain threshold. You could even look at this in the same test and look at the drop-off from peak to the end of the test.
-
Bilateral ratios from dominant vs. non-dominant sides.
Conclusion (Part 1)
Our goals of having an objective test for the upper extremity have certainly been met, and we can even use the same technology we use for lower body assessments--which is great!
Remember - this is a new test so you, the user, get to be one of the trailblazers that explores its uses and meanings. However, we cannot change what we do not measure, and this test gives us an excellent starting point for understanding the upper body strength profiles of our athletes so we can begin to find more and more ways to help them improve.
- If you have questions about this article, Aaron can be reached at aaron.trunt@sanfordhealth.org
- Part 2 of the ASH Test blog series by Aaron Trunt can be found here.
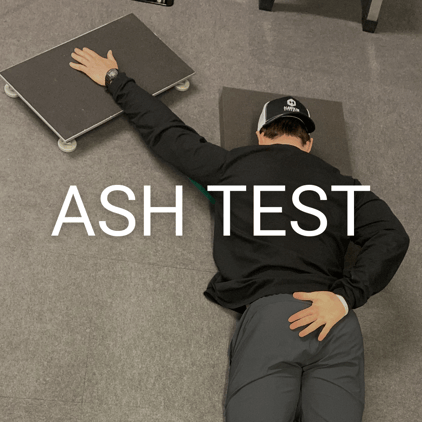 Figure 5: ASH Test on Hawkin Dynamics Force Plates
Sources: