-2.png?width=156&height=60&name=Hawkin%20Logo%20(2)-2.png)
We can be honest, we know the HD Cloud is a great tool for our users to aggregate, visualize, sort, and report all your test data. That's because we have spent years of development to ensure it provides all of our users with the most useful and up-to-date reports needed by performance professionals, physical therapists, and high-performance teams alike. We also know there are quite a few of our users who include their test data as just one part of their decision-making processes, and there is a need to integrate their HD test data with data from other sources.
We are happy to make accessing your data easy, with the use of our export functions on our cloud site and our open API integration for all users. Some of you may already be taking advantage of this with one of the Athlete Management Systems (AMS) that we already have an established integration with. There is however now another way to pull data into your own ecosystem without a standard AMS. We made accessing the data through the API even easier.
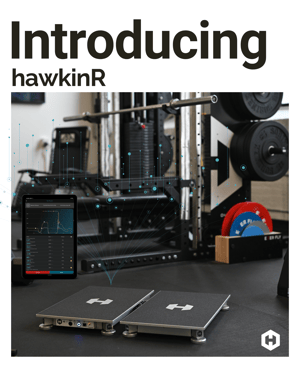
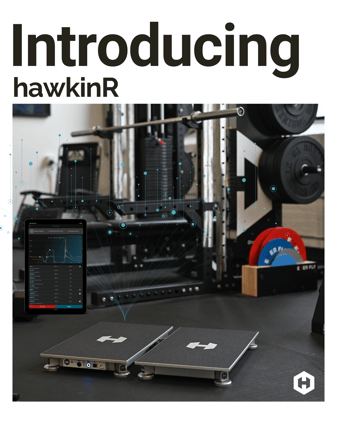
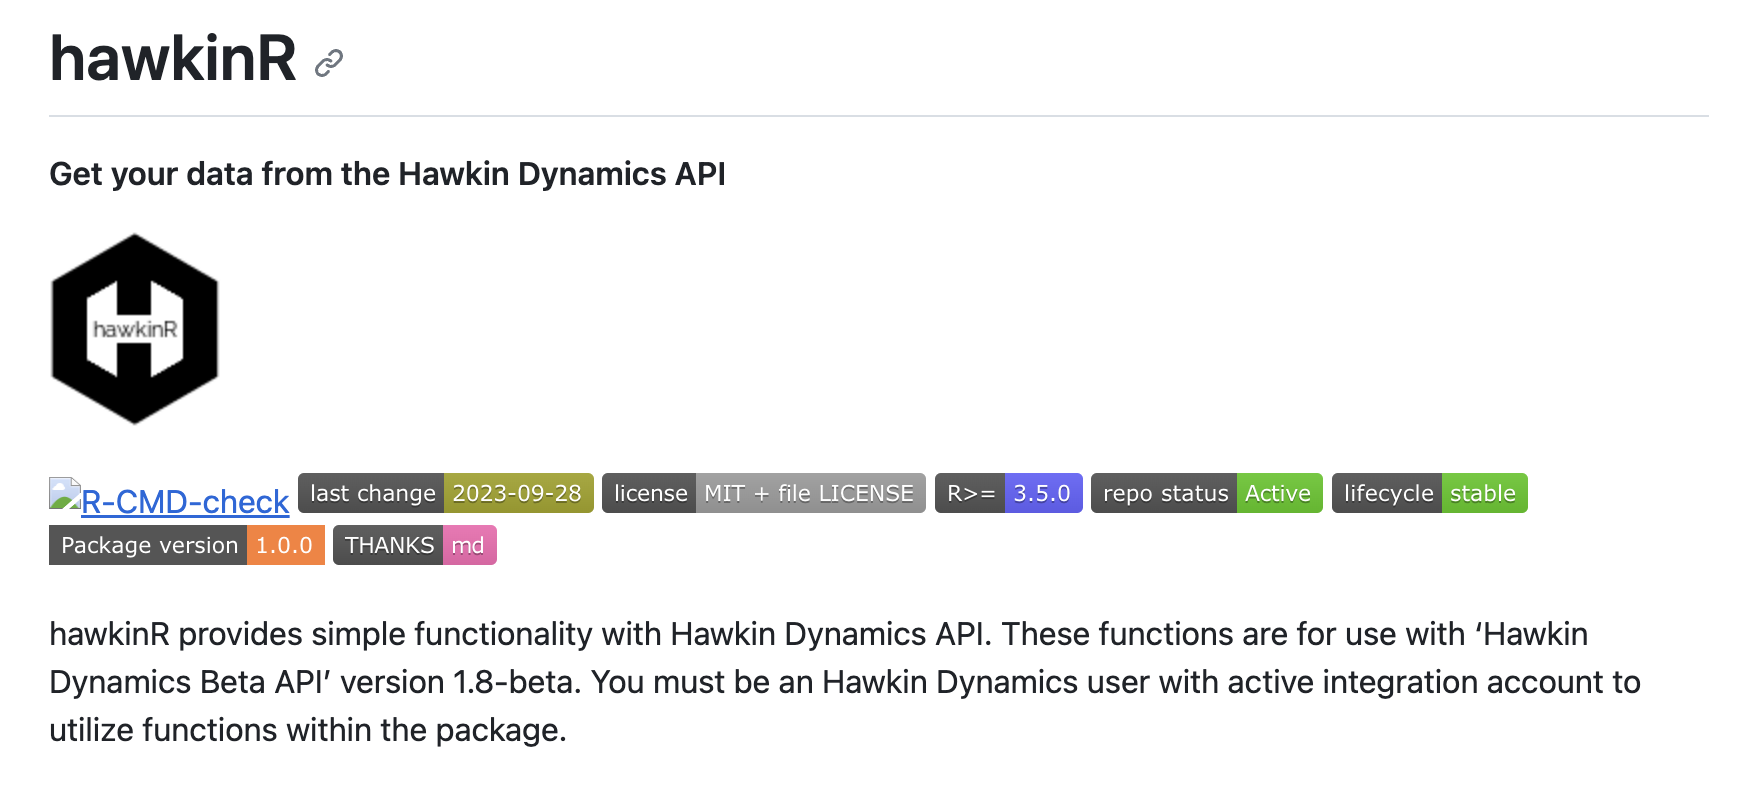
Introducing the hawkinR package for R!
The hawkinR package was developed specifically for our users to access and interact with their data with just a couple of lines of code. Although there may be many users who are already proficient in R, this new package aims to help our users who might aspire to learn this programming language an easy way to access their data and allow them to explore it with as little friction as possible.
We built this package for the R programming language, but its utilization also reaches beyond RStudio (the most popular IDE used for R programmers). Many of our users take advantage of Microsoft’s Power BI (PBI) software to organize their many data sources and build dashboards to visualize their data to help gain insights and have efficient methods of decision-making.
R scripts (including the use of our package) are the best way to utilize bringing data into PBI via an API. Using an R script to get web data is actually a preferred method by PBI developers, before using the built-in “web data source” functionality in the software.
What exactly is R?
The R programming language is like the Swiss Army knife of data analysis. It’s a super versatile, open-source tool that’s gained a huge following in fields like sports science. Born in the early ’90s, R has become one of the most common tools for researchers, analysts, and anyone who loves diving into data. Being open-source means that the community of R users also contributes to its development. So packages like hawkinR, can be developed and distributed to other users who have similar tasks and can benefit from shared code.
In the realm of sports science, R can be a game-changer. Whether you’re working with athlete performance data, injury analysis, or in-game analytics, R offers an array of statistical techniques and graphical tools that enable you to explore, model, and present your findings effectively. From creating visualizations that depict jump performance over time to conducting in-depth statistical analyses to identify trends and patterns, R equips sports scientists with the tools they need to push data-driven decision-making in the performance world. And now, hawkinR makes it that much more accessible for our users.
Stay tuned! In the coming weeks, we'll walk you through the hawkinR package and the simple and basic steps to do when first gathering your data. It’s also important to note for our PBI users, that you can simply copy and paste these scripts into PBI for use there.