-2.png?width=156&height=60&name=Hawkin%20Logo%20(2)-2.png)

The newest Hawkin Dynamics Cloud update enables users to build visually appealing and digestible reports with ease.
Each report is available for one-click download & print with both a black and white background to easily disperse among your staff.
>>Prefer a video?
Reporting Options
In the Hawkin Cloud Update, there are now 7 reporting options (as of Nov. 16, 2021)
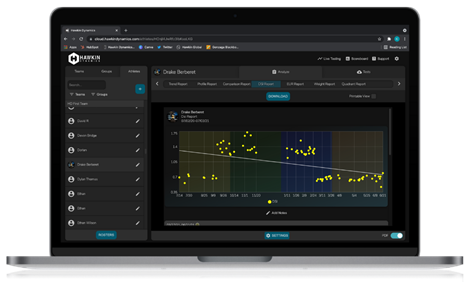
(A) Trend Reports (Trends overtime for an individual, group, or team)
- Allows you to set date ranges and select specific metrics to view the trends of your athletes
- Scatter plot with a best-fit trend line. Can view with a hard-coded date range or moving average.
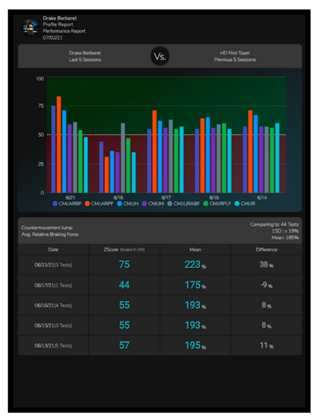
(B) Profile Report (Profile with a Radar or Bar Graph)
- Allows you to choose any test type & 3 to 7 metrics to profile
- Profile an athlete against his/herself, the team or a select group (i.e. position, age, etc)
- Use z-scores (-4 to +4) or scaled z-scores (0-100)
- Recently we added a TSA Score, learn more here.
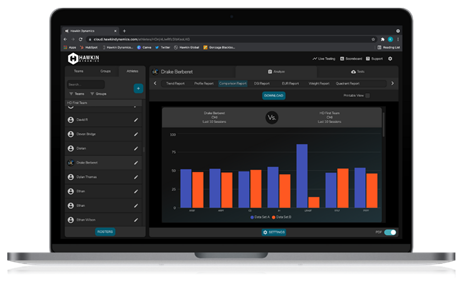
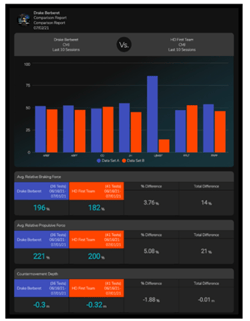
(C) Comparison Report
- Compare an athlete against his/herself, the team or a select group
- You can select the specific metrics you would like to compare as well as the date range
- This can be useful when looking at changes in performance between training blocks, readiness day-to-day, week-to-week or year-to-year
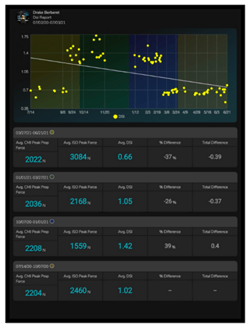
(D) DSI Report (Dynamic Strength Index)
- The DSI report is a simple ratio of CMJ and a maximal Isometric Test (Typically the Isometric Mid-Thigh Pull or Isometric Belt Squat). DSI is useful for assessing an athlete’s needs – strength or speed.
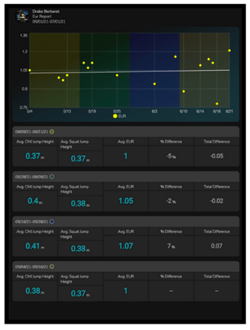
(E) EUR Report (Eccentric Ratio Utilization)
- The EUR is simply a ratio of CMJ and Squat Jump. EUR is useful for assessing an athlete's stretch-shortening cycle function overtime.
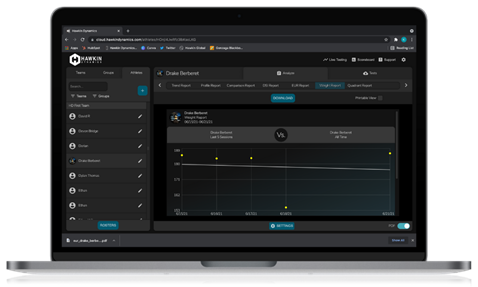
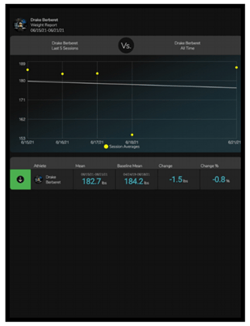
(F) Weight Report
Every time an athlete is on the force plates, system weight is accurately calculated and reported in real-time. This new report shows the athlete’s body weight trend over a set date range.
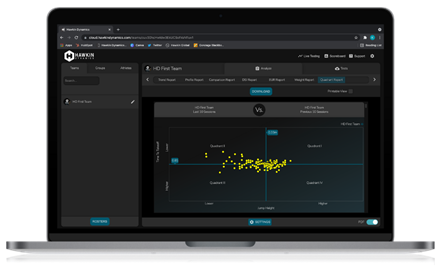
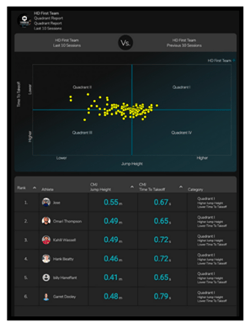
(G) Quadrant Report
- This report allows to see where each athlete is stacked up in comparison to each other. By taking two metrics and setting them on the X and Y axis, athletes are put in the quadrant that represents their metrics. Quadrant I represents the top performers while Quadrant III represents the bottom performers.
(H) TSA Report (Total Score of Athleticism)
- Read a full article on the TSA report here.
- In summary, this report allows you to score similar athletes against one another in one report (1-100). a total score of 100 would mean that the athlete is the very best in ever test/metric for the given time period. A score of 50 is average.
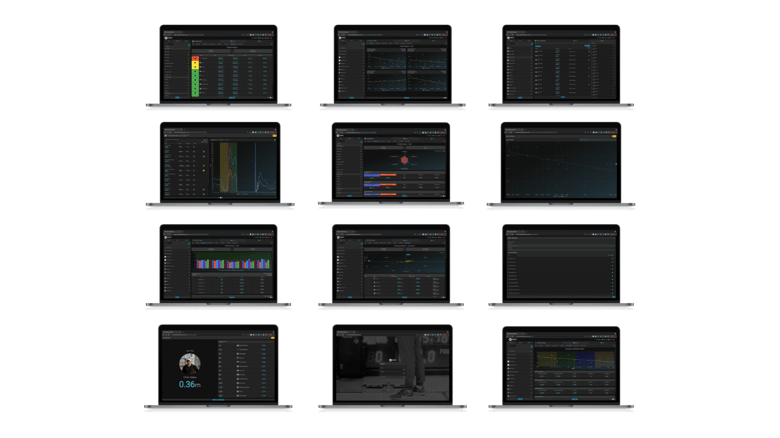
Images of Each Report:
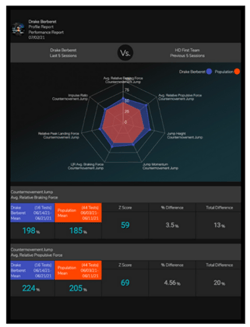
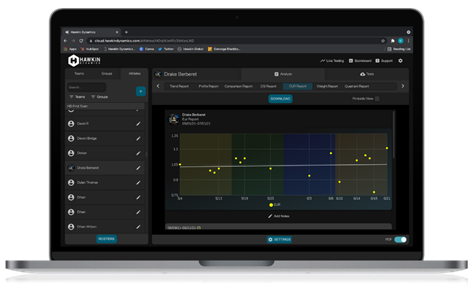
*The top image is a view of the trend report on the Hawkin Cloud. The bottom image is a view of the PDF download.
(A) Trend Report
Individual Athlete Trend Report
.png?width=428&height=241&name=Cloud1-dayOut_TWITTER%20(2).png)
Individual Athlete Trend Report 
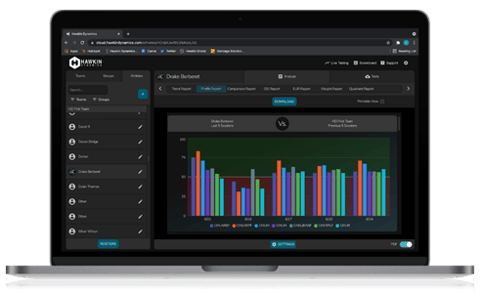
(B) Athlete Profile Report
Radar Option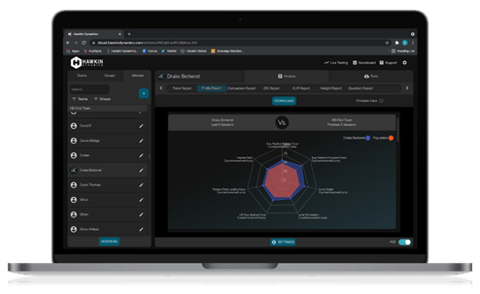
Radar Option
Bar Chart Option
(C) Comparison Report
(D) DSI Report
(E) EUR Report
(F) Weight Report
(G) Quadrant Report
Analytical Advising
We also offer additional analytical support from our team of researchers & sports scientists. We can be as involved, or hands-off as you'd like. Services include optimizing testing flow, metric selection & interpretation, programming help based on your organization’s analytics, and much more.
Email Drake, our Director of Sport Science drake@hawkindynamics to learn more about this option.
Questions?
Have questions about these reports or want to schedule a free virtual demo to see how the cloud works in real time? Contact us at info@hawkindynamics.com or message us on Instagram.
.png?width=1500&name=LETS%20WIN%20TOGETHER.%20(3).png)