

Every assessment you record with Hawkin creates a force-time signal (waveform) from which metrics are derived. The API (Hawkin Connect), paired with HDforce — Hawkin's official Python package, puts that signal in your hands. It is yours to export, yours to analyze in Python, R or an athlete management system you already use. This article explains why to export the waveform “going beyond the cloud”, and what you can do with it in Python once you have it.
The signal is yours. The methods are published. The analysis is customizable.
Open by design
Go beyond the metrics that are delivered immediately after each test and stored in the Hawkin Cloud.
Five things make that possible:
- The data is yours. We never access or share it without permission.
- The API is open. HDforce, our Python package, and equivalent R tooling sit on top of it, enabling custom analysis beyond the cloud. With custom team level API tokens you can access project data without sacrificing organizational privacy.
- The definitions are public. Every metric definition is published openly in the Metric Database.
- The method has not changed. A standardized dual wireless plate design, signal processing and metric definitions have been unchanged since 2017. Meaning a trial recorded today stands alongside one recorded a decade ago.
- The signal is fixed. Every Hawkin system samples at 1000 Hz. Every jump repetition is weighed over a full second, and a trial that fails to the quality check is not captured.
A custom force-time curve analysis
Between a raw force trace and a reported jump height are two key decisions: how to estimate body weight and how to identify movement onset. Both have several defensible approaches. A 2026 study applied 30 combinations of these choices to the same raw signals from 32,952 CMJ trials involving 579 NCAA Division I athletes (Adlou et al., 2026). The analysis method alone changed jump height by more than the 2 cm smallest worthwhile change in roughly one-third of trials. Hawkin’s standardized protocol protects data quality while allowing you to customize the analysis.
The same study notes that analysis methods behind a reported number aren’t always documented; the waveform lets you confirm that yourself.
Why export the waveform
Summary metrics are enough for routine monitoring. Export the waveform when you want to:
- See how the jump was produced. Two athletes can jump the same height with different strategies: their countermovement depth, relative force production, and braking and propulsive phase duration; the waveform visualizes this.
- Check every number. Plot the trace, rebuild a metric, or build your own, and compare it directly with the Hawkin Cloud.
- Ask a new question of old data. The signal sits in a file, so when your question changes, you can reanalyze old data instead of retesting to trial new analysis methods.
- Work in any tool. A waveform is just time and force, so Python, R, MATLAB or your own software can read it.
- Make the method reportable. State each step so a reviewer can follow it clearly, and readers of your research can replicate it.
What you can do with it in Python
Each waveform from a dual wireless force plate trial exported from the Hawkin Cloud carries left, right, and combined force, plus velocity, displacement, and power, sampled at 1000 Hz. HDforce handles authentication and retrieval in a few lines of code. Install it with `pip install HDforce` — so you spend your time on the analysis, not the plumbing. With a consistent approach that is replicable across all Hawkin research projects, you can:
- Look up every metric. Each metric has a published definition in the Hawkin metric database, so you know exactly what you are calculating and can compare it with the Hawkin Cloud.
- Calculate your own metrics. Create metrics of interest and apply the logic to the force time curve to determine applications beyond proprietary software.
- Split the jump into phases. Velocity separates unweighting, braking, and propulsion. From those phases you get unweighting duration, countermovement depth, peak braking force and velocity, and average propulsive force.
- Compare whole waveforms. Statistical parametric mapping tests the full curve, not a single point on it.
- Plot loops and profiles. Build force-velocity loops, force-displacement loops and force-velocity profiles from the same file, see Dr Jason Lake’s archive piece on why force-velocity loops matter. View Jason’s blog post here.
- Run temporal phase analysis (TPA). TPA gives you a standard way to standardize and compare force time data between repetitions, groups (McMahon et al., 2017), or phases of training (Cormie et al., 2009).
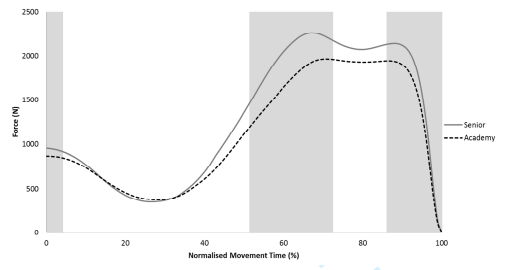
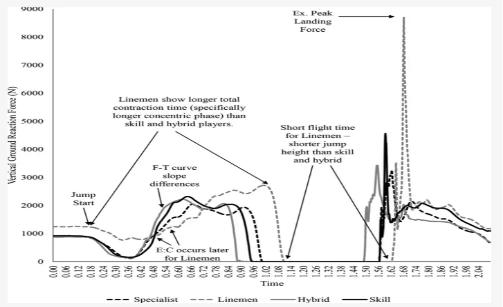
- Find archetypes. Group athletes by waveform shape to see if “how” force production differs between positions groups (Merrigan et al., 2022).
How it has been done.
Smith (2024) published a Python workflow for analysing many countermovement jumps over time: it estimates body weight from quiet standing, detects movement onset, integrates net force to get velocity and displacement, then uses velocity to split the jump into phases. Pull the waveform with HDforce and each step runs on it directly, so you can rerun the same workflow on any jump you have recorded. View Smith (2024) article here.
What this means for teaching the next generation of sport scientists.
If you're teaching the next generation of sport scientists, you want students to question proprietary software, not take it on trust. The Hawkin API lets them rebuild the metrics in Python or R, compare them with the Hawkin Cloud, and see how metrics are built and how they differ by using custom analysis methods.
The API replaces manual CSV exports and removes the task-induced errors of doing it by hand, so large projects move faster, and student workflow improves which matches the pace of technology.
Scoped API tokens, not shared logins.
Hawkin Cloud provides organization-level API access with flexible token scoping. An organization administrator can issue a token for the entire organization, a selected group of teams, or as few as one team. This lets research groups, classes, and clinical projects access only the data they need without sharing an organization login or exposing unrelated teams. Each token can be aligned with the project’s ethical approval, consent scope, and data-handling requirements. In practice:
- Students access their project data. A token can be scoped to one team when a project requires only that dataset.
- Researchers access the teams in their study. A token can include multiple selected teams without opening access to the entire organization.
- Practitioners access the data they support. A token can cover one team, several teams, or the whole organization, depending on their role.
- Organization administrators stay in control. Admins choose each token’s scope, monitor its use, and revoke it without changing anyone else’s access.
Scope each API token to the minimum data required: the whole organization, a selected group of teams, or a single team. This flexible access model supports data compliance, protects athlete privacy, and makes the permitted dataset clear in ethics applications, data-management plans, and methods sections.
Frequently asked questions
What does exporting the waveform mean? It means saving the full 1000 Hz force-time record of each jump, not only the summary metrics, so you can analyse it yourself.
Do I need to be a programmer to use the Hawkin API with Python? Not to get started. Hawkin's HDforce package handles authentication and data retrieval. Install it with `pip install HDforce`, and a few functions return your tests and waveforms.
Which regions does the Hawkin API cover? The Americas, Europe and Asia/Pacific. You choose the region when you connect.
Can I give a student access to only one team’s data? Yes. In the Hawkin Cloud, an administrator can scope an API token to a single team or create a token scoped for the whole organisation. Tokens can also be scoped to several selected teams meaning access can be granted to some, but not all teams within an organisation based on applied or research need.
Can I check Hawkin’s metrics myself? Yes. Export the waveform, rebuild the metric, and compare it with the Hawkin Cloud. The metric definitions are published.
Your data, your way. Explore the Hawkin API.
References
Smith JC. Using Python to analyze multiple countermovement vertical jumps over time. Strength Cond J. 2024;46(3):369–377.
Harry JR, Blinch J, Barker LA, Krzyszkowski J, Chowning L. Low-pass filter effects on metrics of countermovement vertical jump performance. J Strength Cond Res. 2022;36(5):1459–1467.
Adlou B, Goodlett M, Roper J, Aakur S, Wilburn C, Weimar W. Pipeline choice drives within-trial variation in countermovement jump metrics across 32,952 NCAA Division I trials. Sci Rep. 2026 (in press). doi:10.1038/s41598-026-65211-2
Dos’Santos T, Evans DT, Read DB. Validity of the Hawkin Dynamics wireless dual force platform system against a piezoelectric laboratory grade system for vertical countermovement jump variables. J Strength Cond Res. 2024.
Kruczek K, Karpęcki S, Gabbett T, Lake J, Nowak M. When does the peak countermovement jump performance occur? Mapping peak-trial timing across six clustered repetitions. J Sports Sci. 2026;44(16):2180–2195. doi:10.1080/02640414.2026.2712762
McMahon JJ, Murphy S, Rej SJE, Comfort P. Countermovement-jump phase characteristics of senior and academy rugby league players. Int J Sports Physiol Perform. 2017;12(6):803–811. doi:10.1123/ijspp.2016-0467123456789101112131415161718192021222324
Cormie P, McBride JM, McCaulley GO. Power-time, force-time, and velocity-time curve analysis of the countermovement jump: impact of training. J Strength Cond Res. 2009;23(1):177–186. doi:10.1519/JSC.0b013e3181889324252627282930313233343536373839404142434445464748
